
Data
Datasets you can download and cite for free: Arctic sea ice, western lakes and U.S. storm outages are published. Every dataset is also on the API and in AI assistants. Paid plans start January 1, 2027. They add higher limits and reports.
Early access includes a free API key until December 31, 2026 (midnight US Eastern). Paid plans start January 1, 2027. Storm reports for storms already in the published tables, and the extras listed for those tables, are free with a free account. Licensed products are by quote. Plans from 2027
Download the data
-
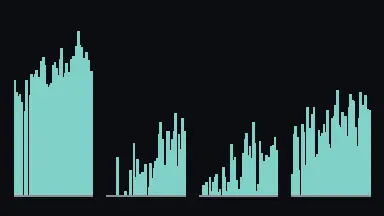
Arctic Open-Water Window
Open-water days each year at 15 fixed gates in the Bering Strait, the Northwest Passage, the Northern Sea Route and Fram Strait, 1978 to 2026.
Version 1.1, 15 gates.
Latest day in the live feed: 22 October 2026. The published version 1.1 ends on 1 October 2026.
Citable copy (Zenodo) · Dataset (Kaggle) · Run the notebook (Kaggle) · Discussion (Kaggle) · Load in Python (Hugging Face)
-
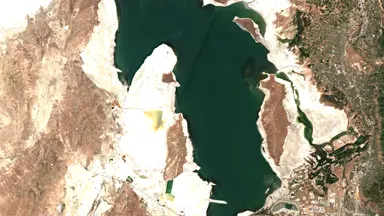
Western Terminal Lakes
Monthly open-water area for 19 series on 18 lakes and reservoirs since 2019, with an uncertainty range.
Version 1.1, 19 series on 18 lakes.
Latest gauge reading in the live feed: 24 October 2026. The monthly table in the published version 1.1 covers through September 2026.
Citable copy (Zenodo) · Dataset (Kaggle) · Run the notebook (Kaggle) · Discussion (Kaggle) · Load in Python (Hugging Face)
-
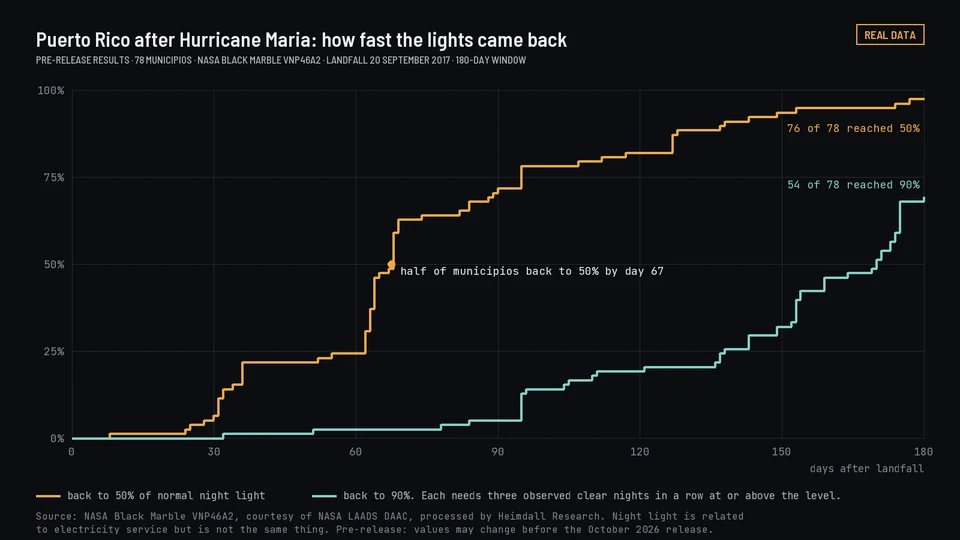
Storm Blackout and Restoration
County power outages and restoration for FEMA-declared storms since 2012, from utility records and satellite night light.
Version 1.2, 672 storms.
Citable copy (Zenodo) · Dataset (Kaggle) · Run the notebook (Kaggle) · Discussion (Kaggle) · Load in Python (Hugging Face)
The live feed is newer data from the API. It can change and is not part of the cited version.
- Arctic. Not for navigation. Use at your own risk. Provided as is, without warranty of any kind.
- Lakes. Not for water-rights, legal or engineering decisions.
- Storms. Estimates from public records and satellite night light. Not for real-time emergency response or for any decision about one address or property.
- Data disclaimers

Look up a storm or a lake
Two of our datasets start from a place. Find a storm or a lake below; each row says what is free and what it costs.
Storm power outages
Every FEMA-declared weather disaster and named storm since 2012, newest first. For each storm and county: customers without power at the peak and as a share of all customers, customer-hours without power, hours until half and nine-tenths were restored, the counties that took longest, what the satellite night-light record shows, and which counties FEMA declared and under which declaration. County data for every storm in the table is free to download. A storm report is free with a free account until December 31, 2026. From January 1, 2027, storm reports are included in Pro and Team. Search by storm, state, county or year, or select a heading to sort.
| Storm | Dates | Location | States | Counties | Status | Type | Year | Access | Scope | Ends | What the data shows | Details | Get it |
|---|
Status: what the published table holds for each storm. Night light and outage run: night-light numbers and a county outage run from utility records. Night light only: night-light numbers and no outage run. Storm row only: a row in storms.csv with a reason code and no numbers. Every row is free to download.
Lake and reservoir water area
Monthly water area from satellite imagery: 19 series on 18 lakes in version 1.1. The table lists all 19: seven terminal lakes, then twelve reservoirs and lakes. Great Salt Lake is split into a north arm and a south arm. For your own lake or reservoir, weekly updates joined to its gauge records are planned. Paid plans start January 1, 2027.
Lakes 1.1. Change compares the 2019 and 2026 averages over the same months, January to September, using only months not flagged as low confidence in either year. The months differ by lake and are listed with each one.
| Lake | State | Type | Latest month (km²) | Latest month | Change since 2019 | What the data shows | Details | Free and paid | |||||||||||||||||||||||||
|---|---|---|---|---|---|---|---|---|---|---|---|---|---|---|---|---|---|---|---|---|---|---|---|---|---|---|---|---|---|---|---|---|---|
| Great Salt Lake, north arm | Utah | Terminal lake | 1,148.2 2026-09 | 2026-09 | -16.2% |
Sample rows from |
|
Free: monthly water area since 2019, with an uncertainty range, under CC BY 4.0. Weekly water area is planned. It is not available yet. Create a free account |
|||||||||||||||||||||||||
| Great Salt Lake, south arm | Utah | Terminal lake | 1,734.9 2026-09 | 2026-09 | -13.4% |
Sample rows from |
|
Free: monthly water area since 2019, with an uncertainty range, under CC BY 4.0. Weekly water area is planned. It is not available yet. Create a free account |
|||||||||||||||||||||||||
| Salton Sea | California | Terminal lake | 756.6 2026-09 | 2026-09 | -8.8% |
Sample rows from |
|
Free: monthly water area since 2019, with an uncertainty range, under CC BY 4.0. Weekly water area is planned. It is not available yet. Create a free account |
|||||||||||||||||||||||||
| Mono Lake | California | Terminal lake | 178.1 2026-09 | 2026-09 | +0.0% |
Sample rows from |
|
Free: monthly water area since 2019, with an uncertainty range, under CC BY 4.0. Weekly water area is planned. It is not available yet. Create a free account |
|||||||||||||||||||||||||
| Pyramid Lake | Nevada | Terminal lake | 415.6 2026-09 | 2026-09 | -0.9% |
Sample rows from |
|
Free: monthly water area since 2019, with an uncertainty range, under CC BY 4.0. Weekly water area is planned. It is not available yet. Create a free account |
|||||||||||||||||||||||||
| Walker Lake | Nevada | Terminal lake | 113.6 2026-09 | 2026-09 | -2.8% |
Sample rows from |
|
Free: monthly water area since 2019, with an uncertainty range, under CC BY 4.0. Weekly water area is planned. It is not available yet. Create a free account |
|||||||||||||||||||||||||
| Lake Abert | Oregon | Terminal lake | 114.5 2026-09 | 2026-09 | -5.0% |
Sample rows from |
|
Free: monthly water area since 2019, with an uncertainty range, under CC BY 4.0. Weekly water area is planned. It is not available yet. Create a free account |
|||||||||||||||||||||||||
| Lake Mead | Nevada and Arizona | Reservoir or lake | 288.1 2026-09 | 2026-09 | -12.6% |
Sample rows from |
|
Free: monthly water area since 2019, with an uncertainty range, under CC BY 4.0. Weekly water area is planned. It is not available yet. Create a free account |
|||||||||||||||||||||||||
| Lake Powell | Utah and Arizona | Reservoir or lake | 249.7 2026-09 | 2026-09 | -31.0% |
Sample rows from |
|
Free: monthly water area since 2019, with an uncertainty range, under CC BY 4.0. Weekly water area is planned. It is not available yet. Create a free account |
|||||||||||||||||||||||||
| Elephant Butte Reservoir | New Mexico | Reservoir or lake | 8.4 2026-09 | 2026-09 | -33.2% |
Sample rows from |
|
Free: monthly water area since 2019, with an uncertainty range, under CC BY 4.0. Weekly water area is planned. It is not available yet. Create a free account |
|||||||||||||||||||||||||
| Falcon Reservoir | Texas | Reservoir or lake | 109.5 2026-09 | 2026-09 | -32.1% |
Sample rows from |
|
Free: monthly water area since 2019, with an uncertainty range, under CC BY 4.0. Weekly water area is planned. It is not available yet. Create a free account |
|||||||||||||||||||||||||
| Flaming Gorge Reservoir | Wyoming and Utah | Reservoir or lake | 129.5 2026-09 | 2026-09 | -13.0% |
Sample rows from |
|
Free: monthly water area since 2019, with an uncertainty range, under CC BY 4.0. Weekly water area is planned. It is not available yet. Create a free account |
|||||||||||||||||||||||||
| Amistad Reservoir | Texas | Reservoir or lake | 96.7 2026-09 | 2026-09 | -50.9% |
Sample rows from |
|
Free: monthly water area since 2019, with an uncertainty range, under CC BY 4.0. Weekly water area is planned. It is not available yet. Create a free account |
|||||||||||||||||||||||||
| Blue Mesa Reservoir | Colorado | Reservoir or lake | 17.6 2026-09 | 2026-09 | -32.9% |
Sample rows from |
|
Free: monthly water area since 2019, with an uncertainty range, under CC BY 4.0. Weekly water area is planned. It is not available yet. Create a free account |
|||||||||||||||||||||||||
| Upper Klamath Lake | Oregon | Reservoir or lake | 236.1 2026-09 | 2026-09 | -0.7% |
Sample rows from |
|
Free: monthly water area since 2019, with an uncertainty range, under CC BY 4.0. Weekly water area is planned. It is not available yet. Create a free account |
|||||||||||||||||||||||||
| Choke Canyon Reservoir | Texas | Reservoir or lake | 29.6 2026-09 | 2026-09 | -61.6% |
Sample rows from |
|
Free: monthly water area since 2019, with an uncertainty range, under CC BY 4.0. Weekly water area is planned. It is not available yet. Create a free account |
|||||||||||||||||||||||||
| Lahontan Reservoir | Nevada | Reservoir or lake | 18.9 2026-09 | 2026-09 | -12.5% |
Sample rows from |
|
Free: monthly water area since 2019, with an uncertainty range, under CC BY 4.0. Weekly water area is planned. It is not available yet. Create a free account |
|||||||||||||||||||||||||
| American Falls Reservoir | Idaho | Reservoir or lake | 65.0 2026-09 | 2026-09 | -19.7% |
Sample rows from |
|
Free: monthly water area since 2019, with an uncertainty range, under CC BY 4.0. Weekly water area is planned. It is not available yet. Create a free account |
|||||||||||||||||||||||||
| Lake Corpus Christi | Texas | Reservoir or lake | 64.3 2026-09 | 2026-09 | -47.5% |
Sample rows from |
|
Free: monthly water area since 2019, with an uncertainty range, under CC BY 4.0. Weekly water area is planned. It is not available yet. Create a free account |
Need weekly figures for another lake or reservoir? Weekly figures are planned. Request a lake.
Open datasets
| Dataset | What it measures | Coverage | Period | What the data shows | Free and paid | Access | Release | Get it | |||||||||||||||||||||||||
|---|---|---|---|---|---|---|---|---|---|---|---|---|---|---|---|---|---|---|---|---|---|---|---|---|---|---|---|---|---|---|---|---|---|
| Arctic Open-Water WindowIce and snow · Coasts | Open-water days each year at fixed gates in Arctic passages and seas | Bering Strait, Northwest Passage, Northern Sea Route and Fram Strait gates | 1978-10-26 to 2026-10-01 (1978 and 2026 partial) |
Sample rows from |
Free: Latest day in the live feed: 22 October 2026. The published version 1.1 ends on 1 October 2026. The live feed is newer data from the API. It can change and is not part of the cited version. |
Free | Released Published 2026-10-10. Version 1.1, DOI 10.5281/zenodo.23147722. | Download on Zenodo · Hugging Face · Kaggle · Dataset page | |||||||||||||||||||||||||
| Storm Blackout and RestorationWeather · Energy | Night light by county and night after each storm, and reported customers out and restoration times where utility records exist | FEMA-declared U.S. storms: hurricanes, tropical storms, typhoons, winter and severe storms and floods in the states, Puerto Rico, U.S. Virgin Islands and tribal areas | 2012-01-14 to 2026-08-11 (672 storms) |
Sample rows from |
Free: The published version 1.2 runs through 11 August 2026. Paid: Storm reports are free with a free account until December 31, 2026. Paid plans start January 1, 2027. |
Free, with paid options | Released Published 2026-10-10. Version 1.2, DOI 10.5281/zenodo.23010005. | Download on Zenodo · Hugging Face · Kaggle · Dataset page | |||||||||||||||||||||||||
| Western Terminal LakesWater · Deserts | Monthly open-water area of 19 western lake and reservoir series, with an uncertainty range | Great Salt Lake (both arms), Salton Sea, Mono, Pyramid, Walker, Abert, Mead, Powell, Elephant Butte, Falcon, Flaming Gorge, Amistad, Blue Mesa, Upper Klamath, Choke Canyon, Lahontan, American Falls, Corpus Christi | January 2019 to September 2026 |
Sample rows from |
Free: Latest gauge reading in the live feed: 24 October 2026. The monthly table in the published version 1.1 covers through September 2026. The live feed is newer data from the API. It can change and is not part of the cited version. Paid: Weekly lake watch is planned. It is not available yet. |
Free, with paid options | Released Published 2026-10-10. Version 1.1, DOI 10.5281/zenodo.23045007. | Download on Zenodo · Hugging Face · Kaggle · Dataset page | |||||||||||||||||||||||||
| Rapid Burn Severity, Western WildfiresWildfire · Forests | Burn severity for large western fires soon after containment, with uncertainty | Large fires in the western U.S. | 2019 onward | Free: Each fire, about two weeks after containment Paid: A report for your sites by arrangement; portfolio monitoring |
Free, with paid options | In preparation To be announced | |||||||||||||||||||||||||||
| Western Reservoir DigestWater | Monthly reservoir storage next to satellite-measured water area | Major western U.S. reservoirs | To be set | Free: Monthly |
Free | In preparation To be announced |
Each dataset page has the variables, inputs, method, validation and citation. Where a version DOI is listed, that release is published.
Download and API key
-
In the download
Arctic: daily, yearly, climatology and trend tables for 15 gates, gate geometry, the citation and the data dictionary.
Lakes: the monthly area table for 19 series, lake outlines, one WebP preview of each series for each summer, the citation and the data dictionary.
Storms: 14 tables, each as CSV and Parquet:
storms.csv,county_summary.csv,county_daily.csv,utility_by_county.csv,declared_unmatched.csv,tribal_area_summary.csv,tribal_area_daily.csv,tribal_area_counties.csv,tribal_context_county_summary.csv,tribal_context_county_daily.csv,tribal_context_utility_by_county.csv,validation.csv,validation_pooled.csvandvalidation_holdout.csv, with the citation and the data dictionary. The Kaggle copies also have a notebook. -
With a free API key
Arctic full-size COGs:
GET /v1/arctic/gates/{gate}/imagery, MCPget_arctic_imagery.Lakes full-size Sentinel-2 composites:
GET /v1/lakes/{lake}/imagery, MCPget_lake_imagery.Storms:
GET /v1/storms/{event_id}/media,/track,/forecasts, andGET /v1/tracks. MCPget_storm_media,get_storm_track,get_storm_forecasts,find_storm_track,find_storms_near. Sample videos are on the storms page.
Not in this download, free through the API: full-size radar images of the 15 gates, 2015 to 2026, for the weeks that have a usable one. Get a free key.
Not in this download, free through the API: full-size summer satellite images of all 18 lakes and reservoirs, 2019 to 2026. Get a free key.
Not in this download, free through the API: lights-out videos for most storms, storm-path videos for hurricanes and tropical storms, forecast maps and satellite loops. Get a free key.
Licensed products
Planned, priced by quote. Every value carries its source, the version of that source, and the date it took effect.
| Product | Price | Status | What you get |
|---|---|---|---|
| Data-center intelligence | By quote | In preparation | U.S. data-center sites joined to hourly grid demand, generating capacity and planned power plants for each balancing authority (Licensed products are by quote.) |
| Disaster catalog | By quote | In preparation | U.S. disaster events by county, joined to the storm catalog and to reported utility outages. Open dataset downloads stay free forever. (Licensed products are by quote.) |
| Federal review milestone feed | By quote | Planned | Milestones, notices and schedule slippage for federal environmental reviews, filtered by region, state, agency or sector (Later product. Quotes on request.) |
| Portfolio monitoring | By quote | Planned | Your saved boundaries checked against every source update, with a before-and-after for each change (After site screening) |
| Site screening evidence | By quote | Planned | Every federal record that touches a boundary you supply: wetlands, floodplains, streams, habitat, contaminated sites, air-quality areas, historic places and prior federal reviews, each with its source, version, date and distance (Later product. Quotes on request.) |
| Water observation histories | By quote | Planned | One reconciled history per lake or reservoir you name: level, surface area, storage and flow, with a quality flag on every value (Planned.) |
Samples, delivery formats and licensing terms for each product →
What every release includes
-
A Digital Object Identifier. A permanent link, like a serial number, that always points to one exact version of the dataset, so citations don't break. on Zenodo
Arctic Open-Water Window 1.1, Western Terminal Lakes 1.1 and Storm Blackout and Restoration 1.2 each have a DOI on Zenodo. Older versions stay available to cite.
-
Documented method
We publish the definitions, a variables table, the measurement conventions behind every value, and where each input came from, so the data can be judged on its merits and reused without guesswork.
-
A range showing how far the true value could reasonably be from the published number.
Each table names its sources and their versions. Lake areas carry an uncertainty range. Other tables carry quality flags. If a period has no usable data, we leave it blank rather than fill it in.
-
Validation
We check results against independent records and publish that comparison.
-
Corrections
When we find an error, we fix it in a new version and note the change in the A running list of what changed in each version and why..
-
Limits stated
Each dataset page says what the data is not for and how it compares with existing products.
A release carries everything needed to evaluate, cite, and reuse the data, including example code for working with it. The production systems we use to generate a dataset are not part of a release unless the release says otherwise.
Access and license
- Where
- Each dataset has a summary here. When a mirror is published, the files are free to download with no form or sign-up. Arctic, Lakes and Storms are on Zenodo, Kaggle and Hugging Face. Published files are hosted on A free research data archive run by CERN. It assigns DOIs and keeps every version., with a copy on A widely used platform for sharing datasets, with a built-in preview of the data..
- License
- A standard open license, often shortened to CC BY 4.0. Anyone may copy, share, and adapt the data, including commercially, as long as they give credit.. You can reuse the data for any purpose as long as you credit Heimdall Research and cite the version you used.
- Sources
- Open satellite imagery and government data. We include any attribution the original source requires.
- Client data
- Licensed data products are described on the licensed data page. Custom datasets are delivered under separate agreements. Ask us about them.
- Collaborate
- If you work on related research, propose a collaboration.