
Data / Dataset
Storm Blackout and Restoration
How long each county stayed dark after major U.S. storms since 2012, and how fast its lights came back, measured from NASA's nightly satellite light readings. Free catalog; storms are added four to six weeks after landfall.
- Status
- In preparation
- Estimated release
- October 2026 (version 1.0): storms from 2012 to 2017 first, later seasons in following versions
- Version / DOI
- Assigned at release
- Coverage
- FEMA-declared hurricanes, tropical storms, and major winter and ice storms in the contiguous United States, Puerto Rico, and the U.S. Virgin Islands
- Period
- 2012 to present
- Resolution
- County (or county-equivalent) by day, from satellite light readings at about 500 m
- Free updates
- Each new storm, four to six weeks after landfall
- Paid updates
- Within days of landfall, for a named storm or every storm in your region
- Formats
- CSV and Parquet tables; county boundaries as GeoJSON
- License
- CC BY 4.0, with upstream attribution below
- API and MCP
- Access with a free key, opening with the first release in October 2026
Scope
What it is for
- Intended use
- Comparing how quickly places recovered after major storms, studying which communities waited longest, and giving resilience, insurance, and emergency-management research a consistent record across storms and years.
- Not intended for
- Counting customers without power, judging a single address or neighborhood, or real-time response. Light at night is related to electricity service but is not the same thing; see the limits below.
Variables
Columns in each table
| Variable | Units | Type | Description | Valid range |
|---|---|---|---|---|
event_id / name | – | string | Storm identifier (NHC or FEMA declaration number) and name | controlled list |
county_fips | – | string | County or county-equivalent | Census FIPS codes |
day | days | integer | Days since landfall or incident start | −30 to 180 |
light_ratio | ratio | float | Night light compared with the county's pre-storm baseline | ≥ 0 |
observations / valid_pixel_share | count / ratio | mixed | Clear-sky nights behind each value, and the share of usable pixels | ≥ 0 / 0 to 1 |
baseline_nights / baseline_source | count / – | mixed | Nights used for the baseline, and whether it came from before the storm or the same weeks one year earlier | ≥ 1 / controlled list |
| days_to_50 / days_to_90 | days | integer | Days until light stayed at or above 50% and 90% of baseline | blank if not reached |
censored | – | boolean | True when recovery was not reached inside the observation window | true / false |
snow_limited / quality_flag | – | mixed | Marks counties where snow cover or too few clear nights limit the result | controlled list |
Inputs
Sources and required attribution
| Input | Role | License or terms | Attribution |
|---|---|---|---|
| NASA Black Marble daily nighttime lights, VIIRS on Suomi NPP (VNP46A2, version 2) | Measured, 2012 onward | NASA open data; acknowledge and cite | Product citation with DOI 10.5067/VIIRS/VNP46A2.002 |
| NASA Black Marble daily nighttime lights, VIIRS on NOAA-20 (VJ146A2, version 2) | Measured, 2018 onward; continues after Suomi NPP deliveries end on 1 November 2026 | NASA open data; acknowledge and cite | Product citation with DOI |
| NOAA National Hurricane Center best tracks (HURDAT2) and operational tracks | Storm timing and landfall | Public domain | National Hurricane Center |
| FEMA disaster declarations (OpenFEMA) | Which storms and counties are included | Public domain | FEMA |
| U.S. Census Bureau cartographic boundary files | County boundaries | Public domain | U.S. Census Bureau |
| EAGLE-I county outage records (Oak Ridge National Laboratory) | Validation only | CC BY 4.0 | Cited in the validation report |
Method
How values are produced
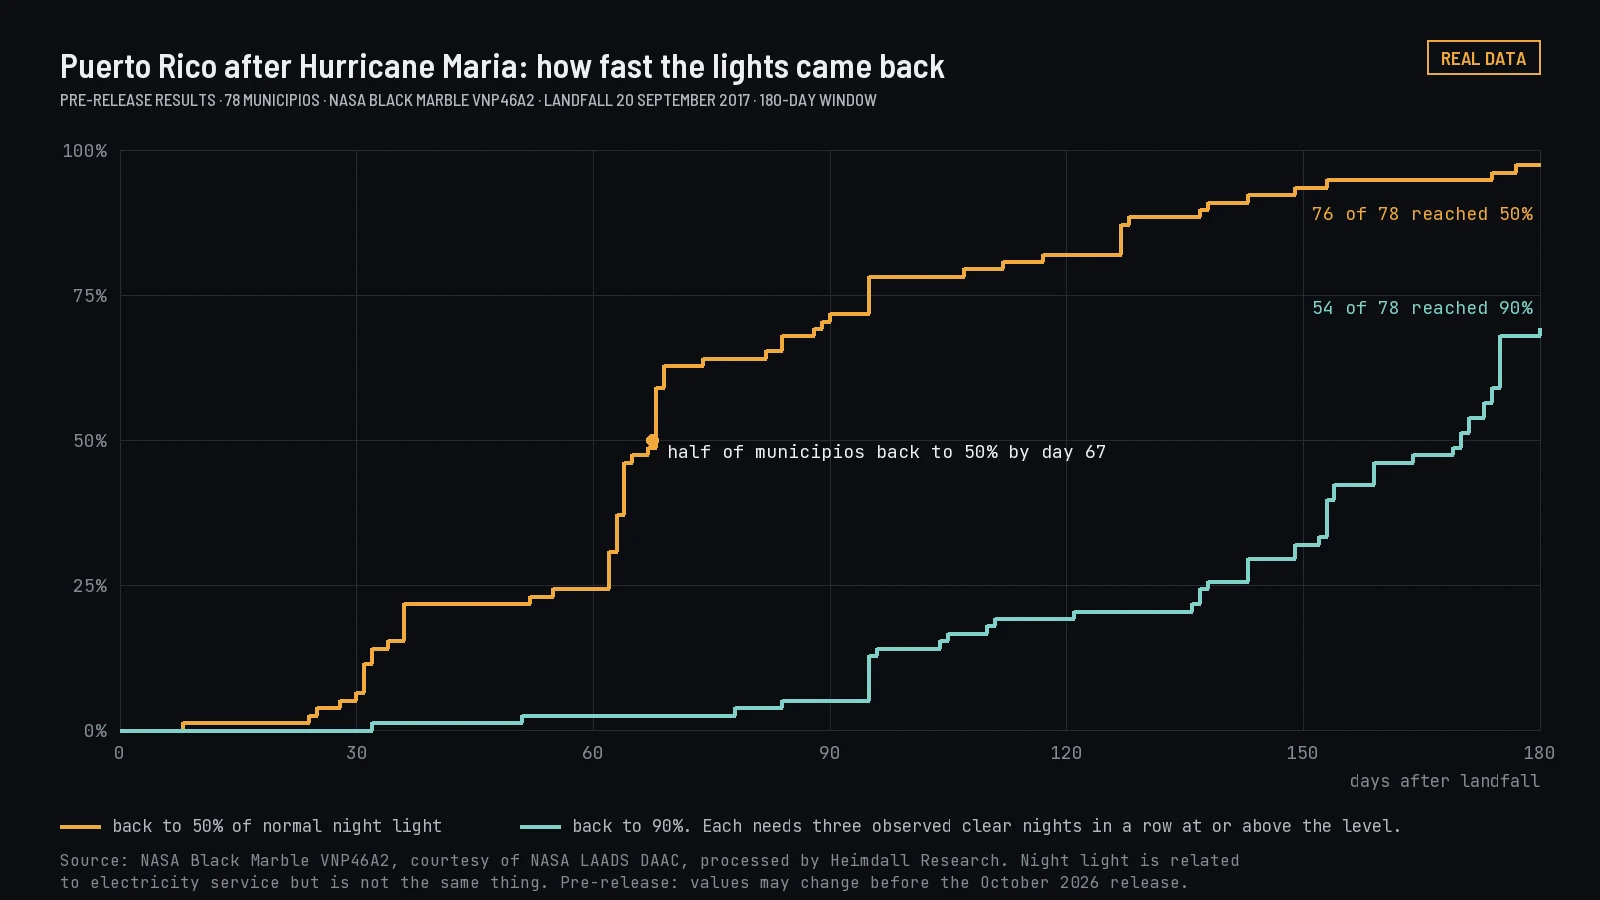
For each storm, the counties in its declared area are compared night by night with their own normal light. The baseline is the median of clear, snow-free nights before the storm, leaving out nights affected by any earlier storm; if too few remain, the same weeks one year earlier are used, and the row says so. After landfall, each clear night is compared with that baseline, and recovery times are counted from when light stays at or above half and nine-tenths of normal for three observed nights. Observation continues until every county recovers or 180 days pass. Pixels flagged for cloud, poor quality, or snow are excluded, and the count of usable nights travels with every value. Records from the two satellites are compared over the years they overlap so the series continues after the older satellite stops delivering data.
Validation
How it is checked
- Outage records
- County light recovery compared with EAGLE-I customer-outage records where both exist, starting with Hurricane Irma in Florida in 2017.
- Published study
- Puerto Rico after Hurricane Maria compared with a peer-reviewed assessment that used the same NASA light product.
- Known limits
- Clouds and snow hide the ground, moonlight and seasonal lighting shift readings, and some light returns before power does (generators) or stays low after it returns (damaged buildings, displacement). Every value carries its observation count, and results are never reported below county level.
Context
How it compares with existing products
Utility outage trackers count customers without power, and NASA publishes before-and-after light maps for individual disasters. Neither gives a consistent, citable record of recovery by county across every major storm since 2012. This dataset provides that record, with its method, uncertainty, and limits published alongside.
Access
Free and paid access
- Free
- The full storm catalog: files on Zenodo and Hugging Face with no sign-up, and the API and MCP server with a free key. Opens at version 1.0.
- Paid
- A report for a named storm and area within days of landfall, and a regional subscription that covers every storm in a region. See plans and prices.
Citation
How to cite
Heimdall Research (2026). Storm Blackout and Restoration (Version 1.0) [Data set]. Zenodo. DOI assigned at release. Please also cite the NASA Black Marble products.
- Versions and corrections
- Each release has its own DOI and a changelog. Report problems through the collaboration form.
- Download
- Files will be deposited on Zenodo with a DOI, mirrored on Hugging Face, and linked here at version 1.0. Downloads are open, with no form or sign-up.
- Use notice
- Preliminary until version 1.0. Values are research data, provided as is without warranty, and may be revised in later versions. Do not use it for emergency response, insurance claims on a single property, or legal determinations.