If we can't trace a figure to a source, we don't report it.
How we work
Not every engagement needs all four stages; we say so when one can be skipped.
01
Define
Agree on the question, what data exists, what the constraints are, and what finished has to look like.
02
Validate
Test the parts we are least sure about before anyone commits to a larger build.
03
Build
Deliver the agreed work in stages you can review as it arrives.
04
Operate
Keep it running, or hand it over documented well enough that someone else can.
Works with the mapping software you already use
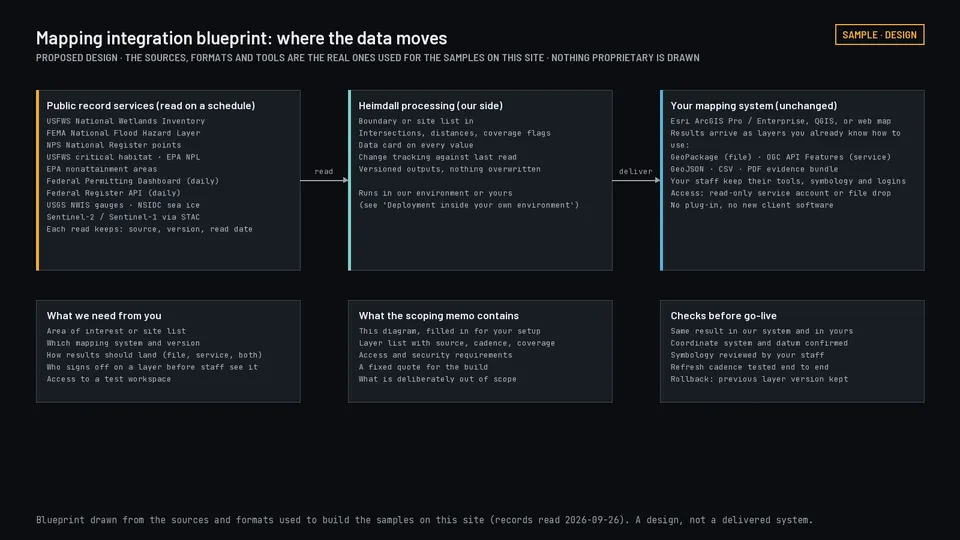
Analysis runs on our side and the results arrive as layers, reports, or a data feed your existing tools can read.
You send
A project boundary, a list of sites, or a schedule, however your team already keeps it.
We run
The analysis, on a schedule or on request, with quality checks before anything is released.
You get
Map-ready layers, a written report, or a data feed another system can call.
Formats
Files open directly in ArcGIS Pro, ArcGIS Online and QGIS: GeoPackage, GeoJSON, Cloud-Optimized GeoTIFF, and CSV with coordinates. The same data is on our API and MCP server; a live layer that ArcGIS can add by web address is not available yet.
Scoped first
Which of these fits depends on your setup, your access rules, and your licensing. We work that out in scoping.
What working together looks like
Open an engagement type to see what it covers, what you receive, what we need from you, and what is deliberately not included. Prices are planning figures, not quotes.
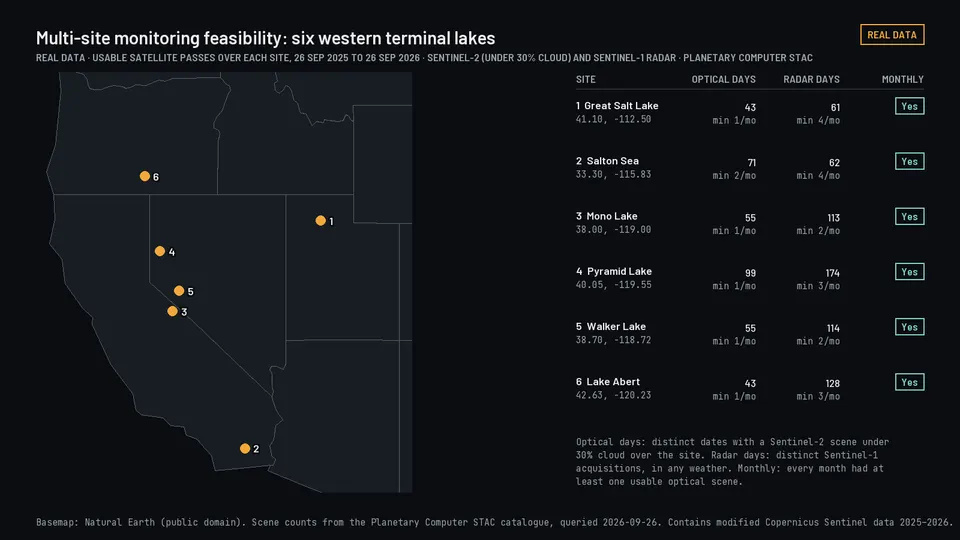
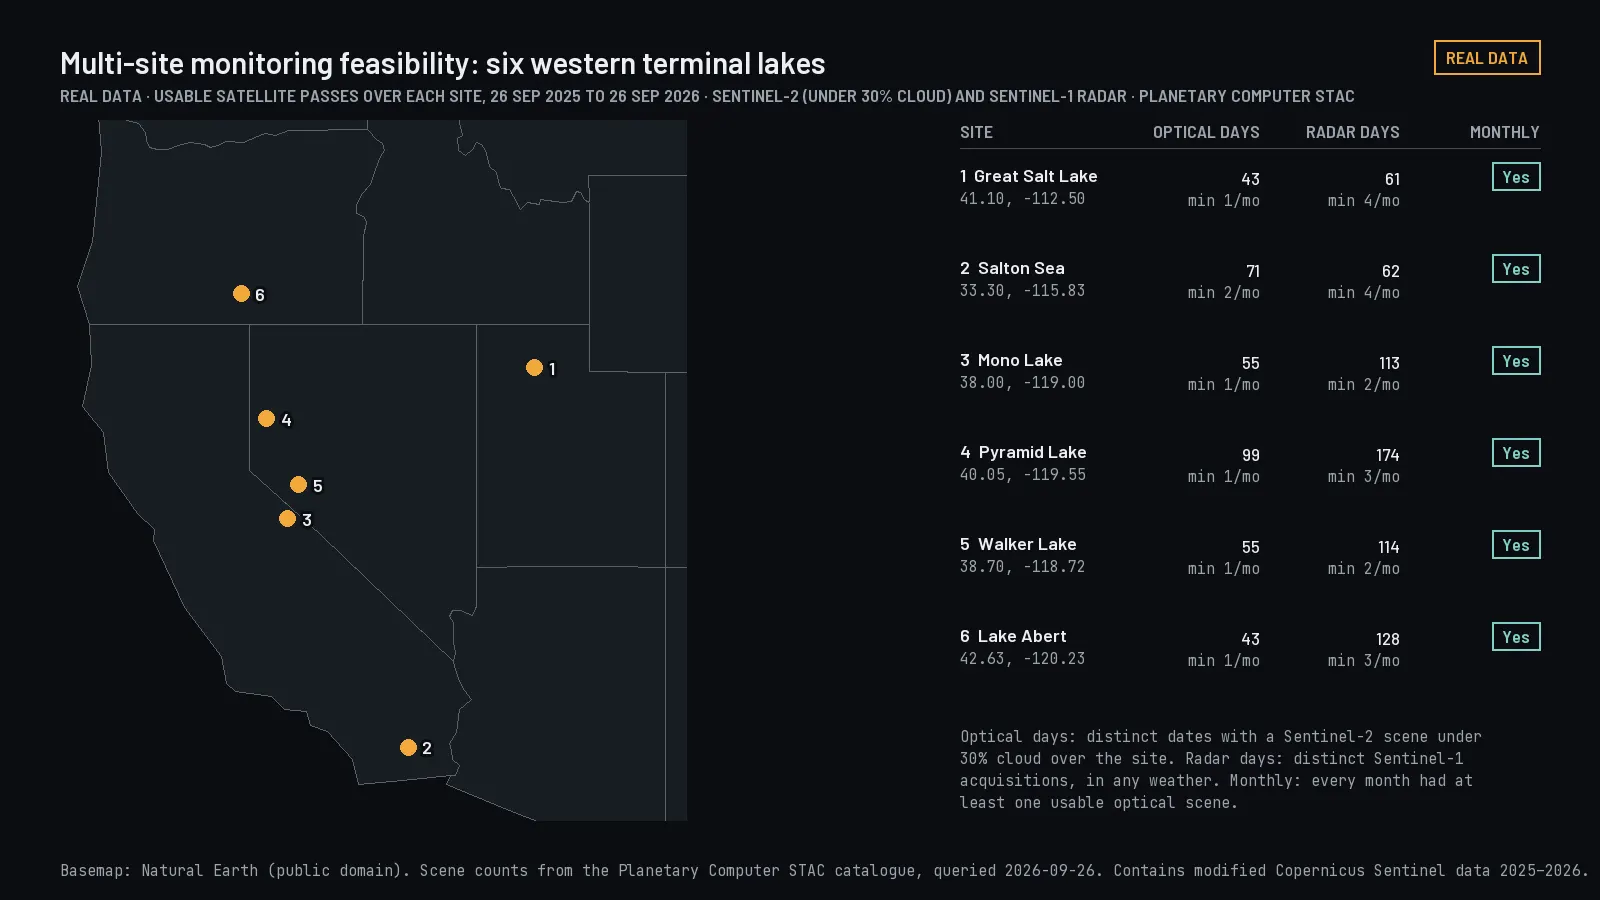
Discovery and scoping$5,000 fixedDefine the problem, find out what evidence exists, and leave with a written plan and a fixed quote for the rest.From the example "Multi-site monitoring feasibility". Usable optical and radar satellite passes over six lakes in the last twelve months.
Deciding which data, approach, or system fits the question, before committing a budget to it.
Scope
Requirements sessions, a review of data you already hold, a coverage check for the area, a feasibility check on satellite observation, a look at your existing mapping setup, integration requirements, technical risks, and the options worth considering.
You get
A written requirements summary, a data assessment, a recommended approach, the assumptions it rests on, the risks, and a scope and price for the next stage.
Timeline
About two weeks.
You provide
The question, the locations, whatever data you already have, the systems it has to work with, and any constraints you know about.
Price drivers
How many systems and people are involved, how large or scattered the area is, and how much is unknown at the start.
Not included
A built application, purchased imagery, or a production system. Scoping ends with a plan.
Illustrative engagement
Multi-site monitoring feasibility
A company with property or facilities in many places wants to know what can realistically be watched from orbit. The output is a memo comparing what different satellites can see, how often a useful update is possible, where coverage falls short, and what running it would cost.
Pictured at the top of this section.
Illustrative engagement
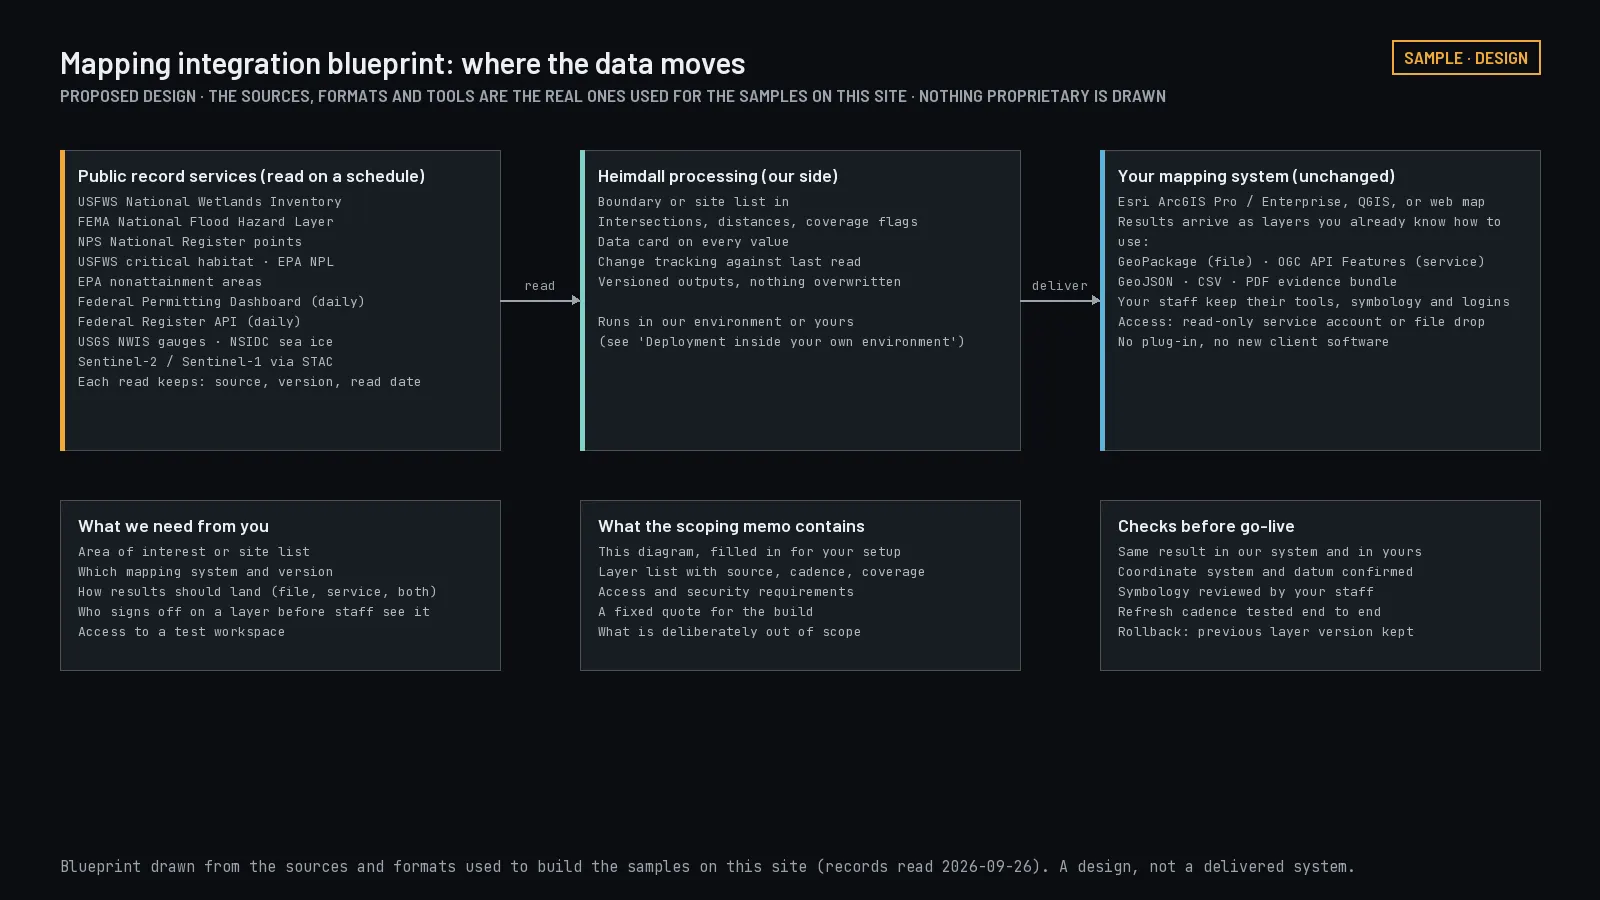
Mapping integration blueprint
An organization wants new analysis without replacing the mapping system its staff already use. The output is a proposed design showing where data moves, what access is required, and how results land in the existing setup.
Proposed design: the sources, formats, and tools behind this site's samples, drawn as a data flow. Select to open.
Illustrative engagement
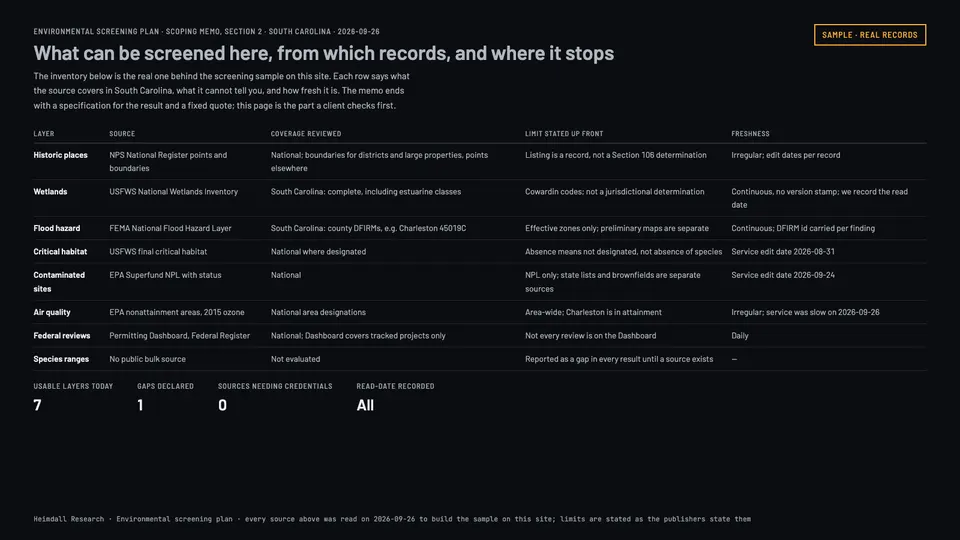
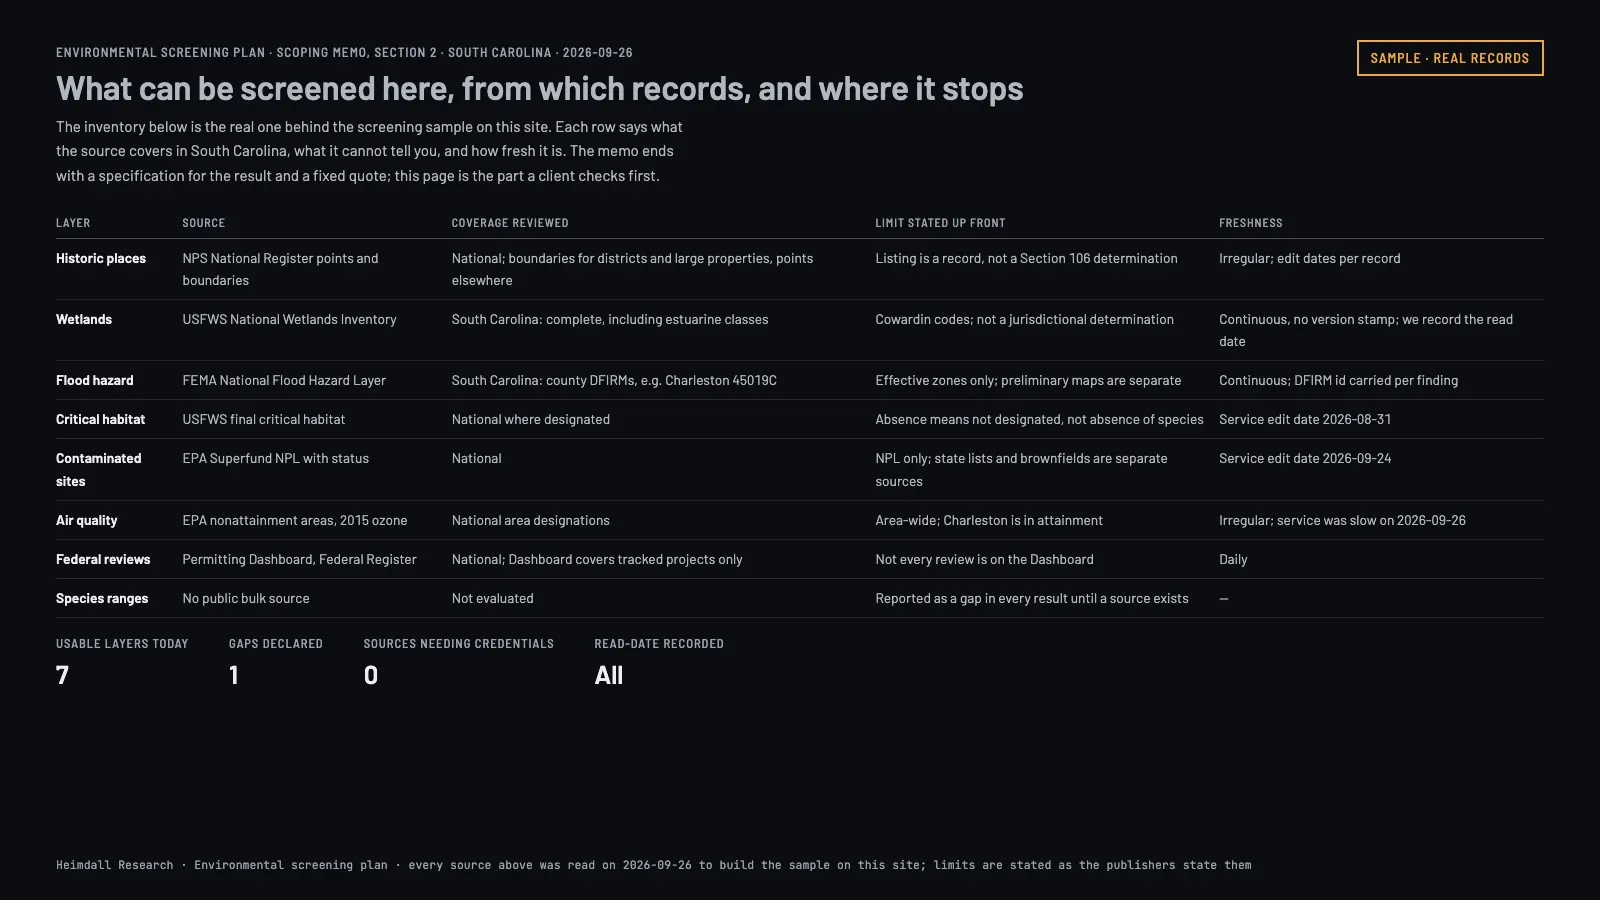
Environmental screening plan
A developer, landowner, or researcher needs to know what environmental screening is possible for an area. The output is an inventory of usable sources, a coverage review, a specification for the result, and a statement of the limits.
Real inventory: what can be screened in South Carolina today, from which records, and where it stops. Planned: Site screening evidence. Select to open.
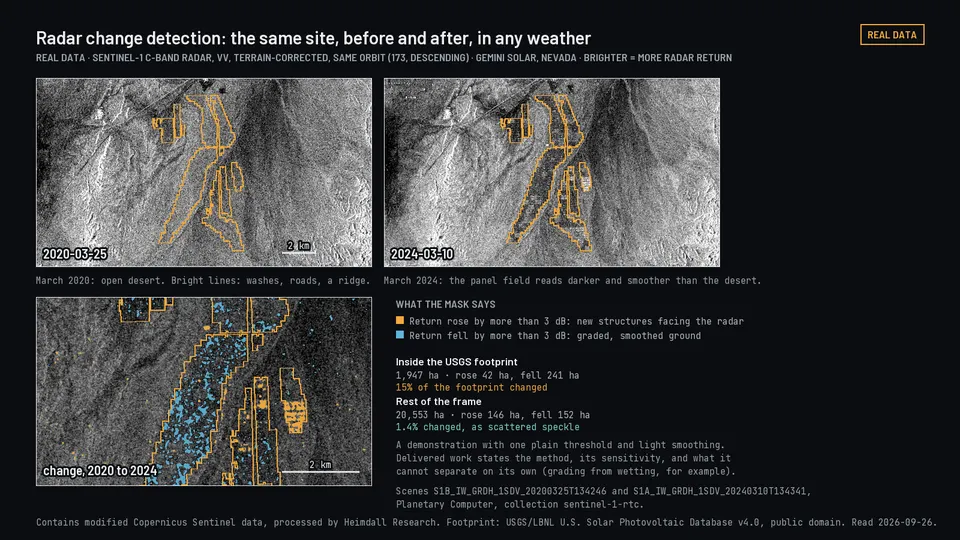
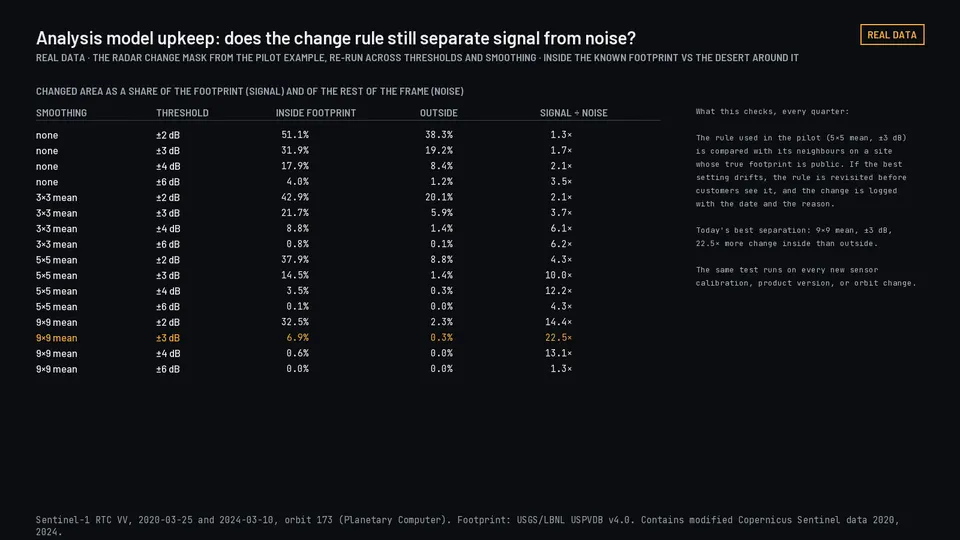
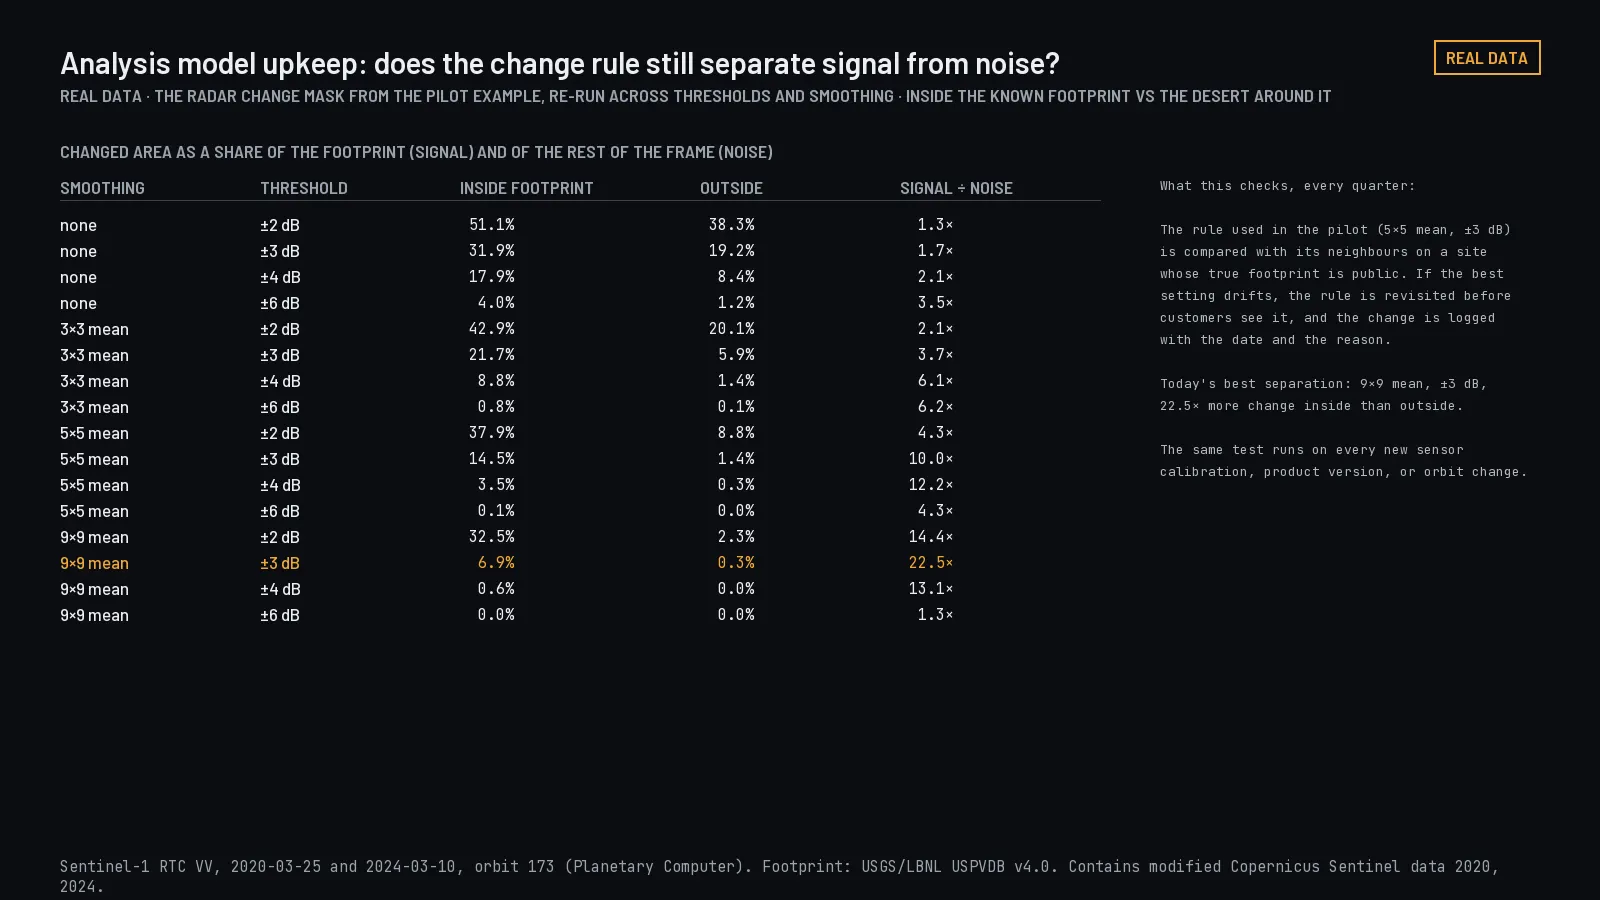
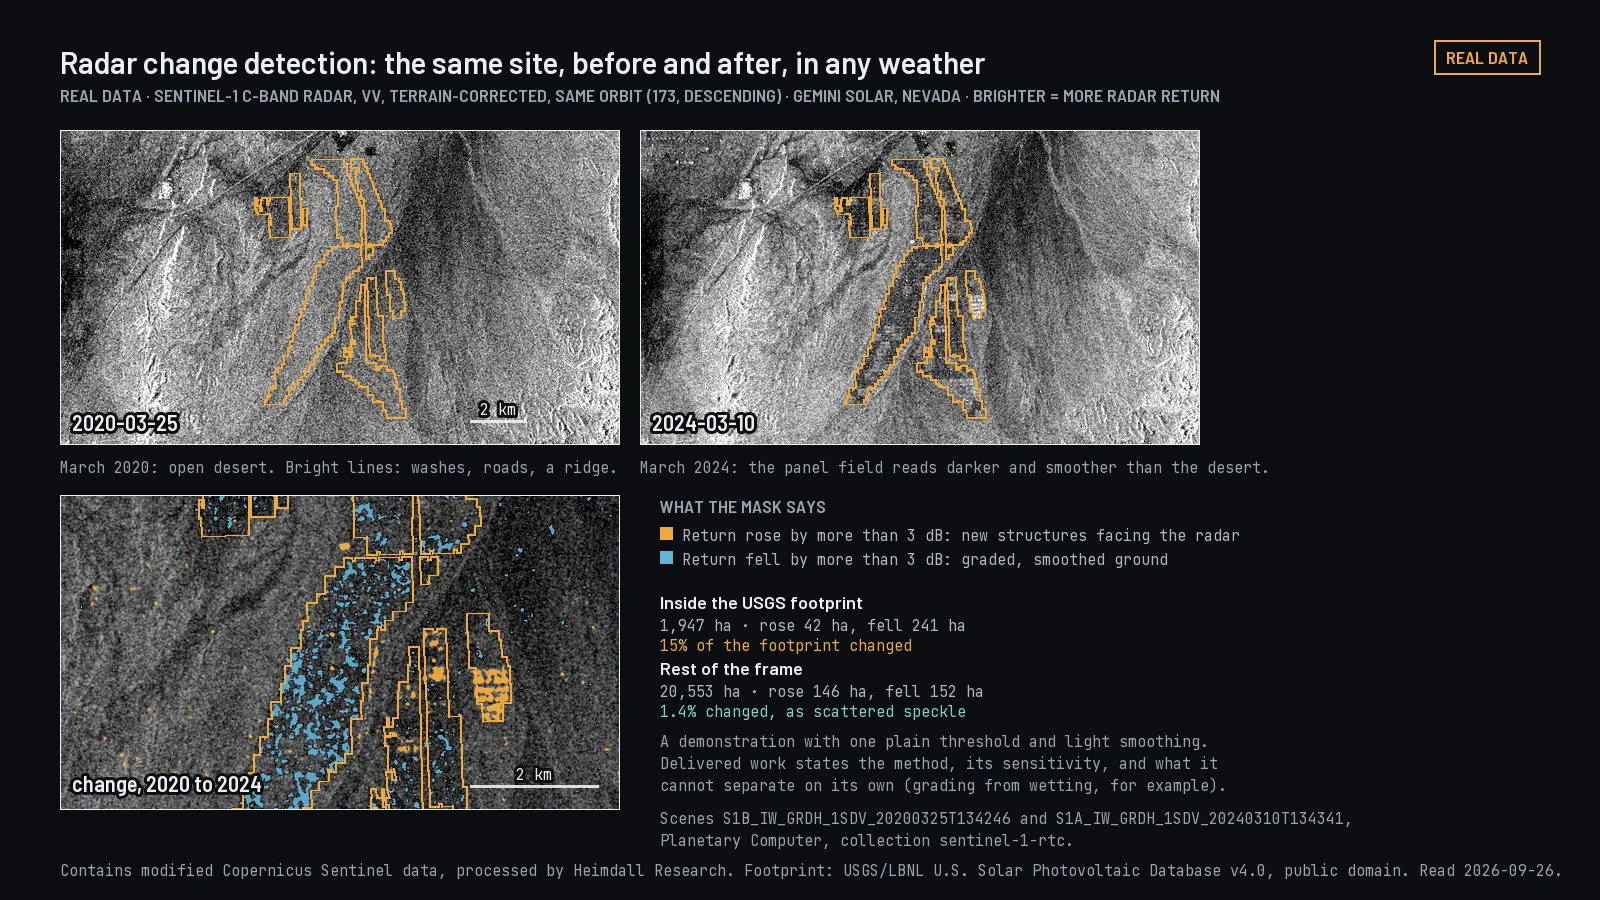
Pilot or focused analysis$9,500-$14,500Test the approach on one real, bounded case before anyone commits to a full build.From the example "Radar change detection". The same Nevada site in radar before and after a solar plant was built, with a simple change mask.
Finding out whether the analysis works on your data, your area, and the way your team works.
Scope
One defined use case, selected sites or dates, a working prototype, limited integration, a first interface, validation against a reference, and a recommendation about production.
You get
A working prototype or focused analysis, documented test results, a written statement of what it catches and what it misses, a walkthrough, and a recommendation to proceed, change course, or stop.
Timeline
Two to six weeks.
You provide
A defined question, representative locations or data, access to the relevant systems, and agreement on what counts as success.
Price drivers
Imagery requirements, size of the study area, how much validation is needed, how far back the history has to go, and how deep the integration is.
Not included
A pilot is not a production system. Scaling, security review, availability, and long-term support are scoped separately and priced separately.
Illustrative engagement
Radar change detection
Test whether radar satellite passes reveal the kind of change that matters at a specific site. The output is the observations used, the changes the analysis flagged, how those compared with what was on the ground, and the conditions under which it failed.
Pictured at the top of this section.
Illustrative engagement
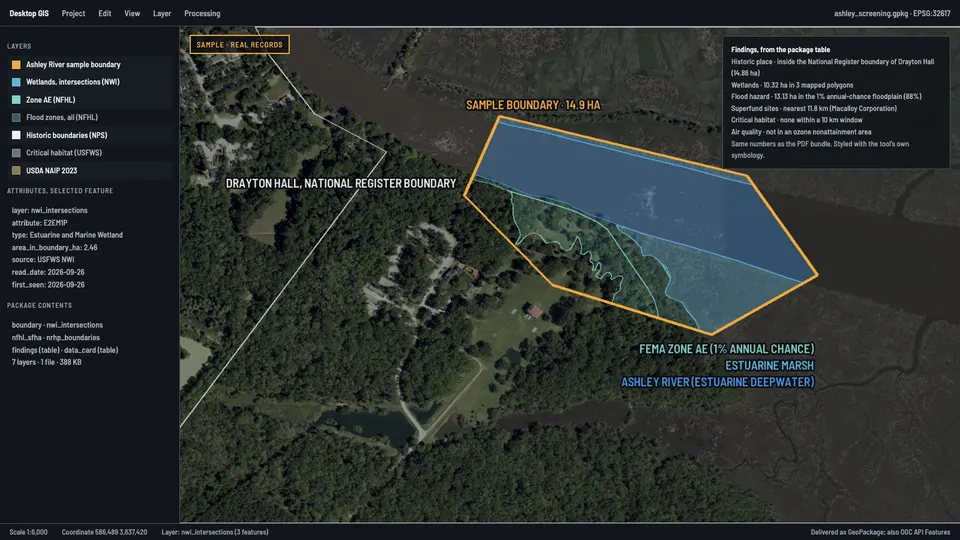
Screening prototype in your own mapping tool
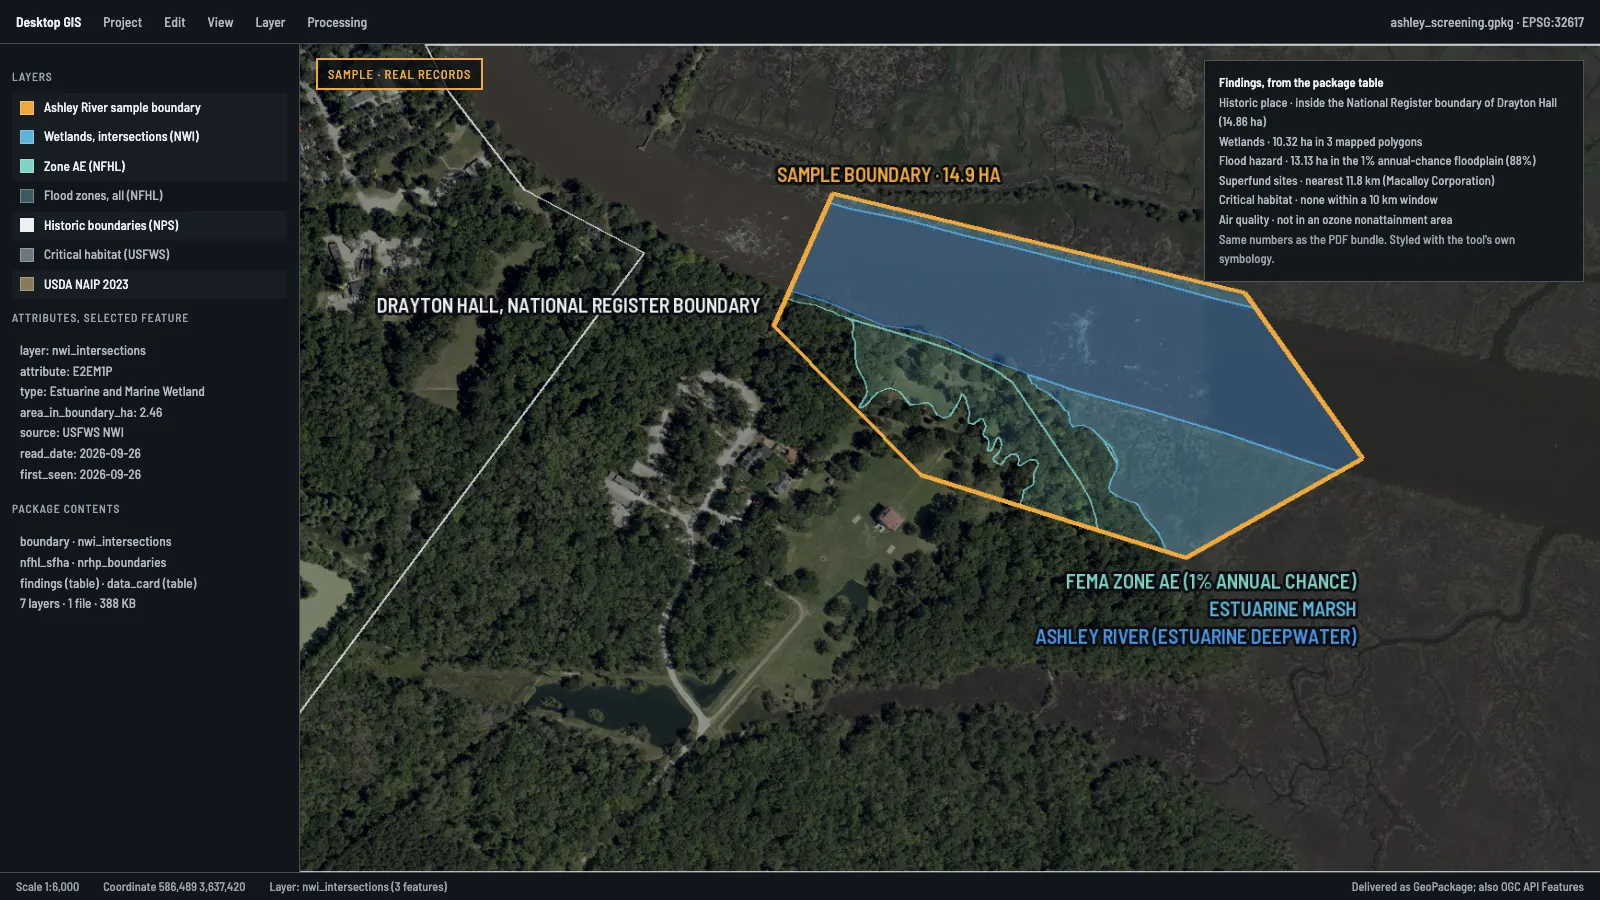
Test a workflow that returns source-linked screening results for an area a user draws, inside the mapping interface your team already opens every day.
Real records delivered as a GeoPackage and opened in a desktop mapping tool. Planned: Site screening evidence. Select to open.
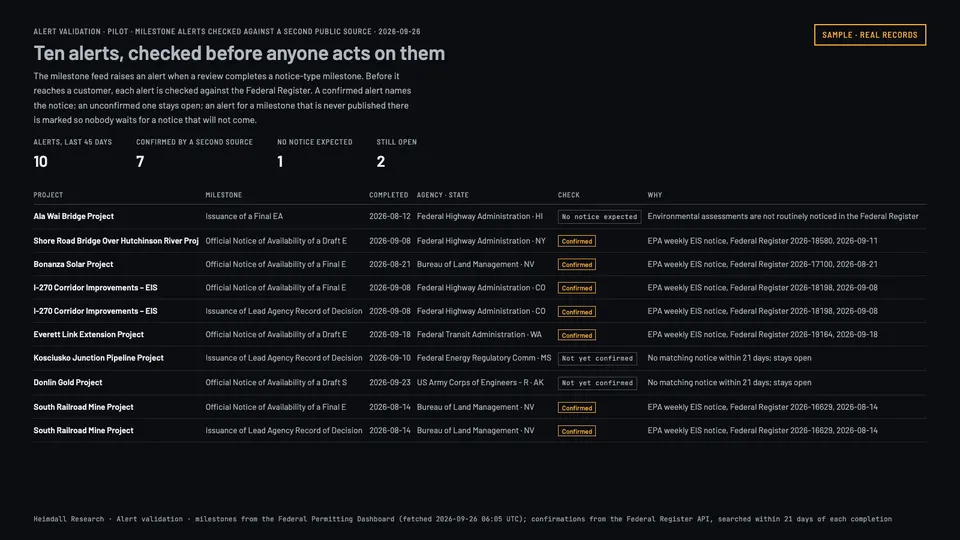
Illustrative engagement
Alert validation
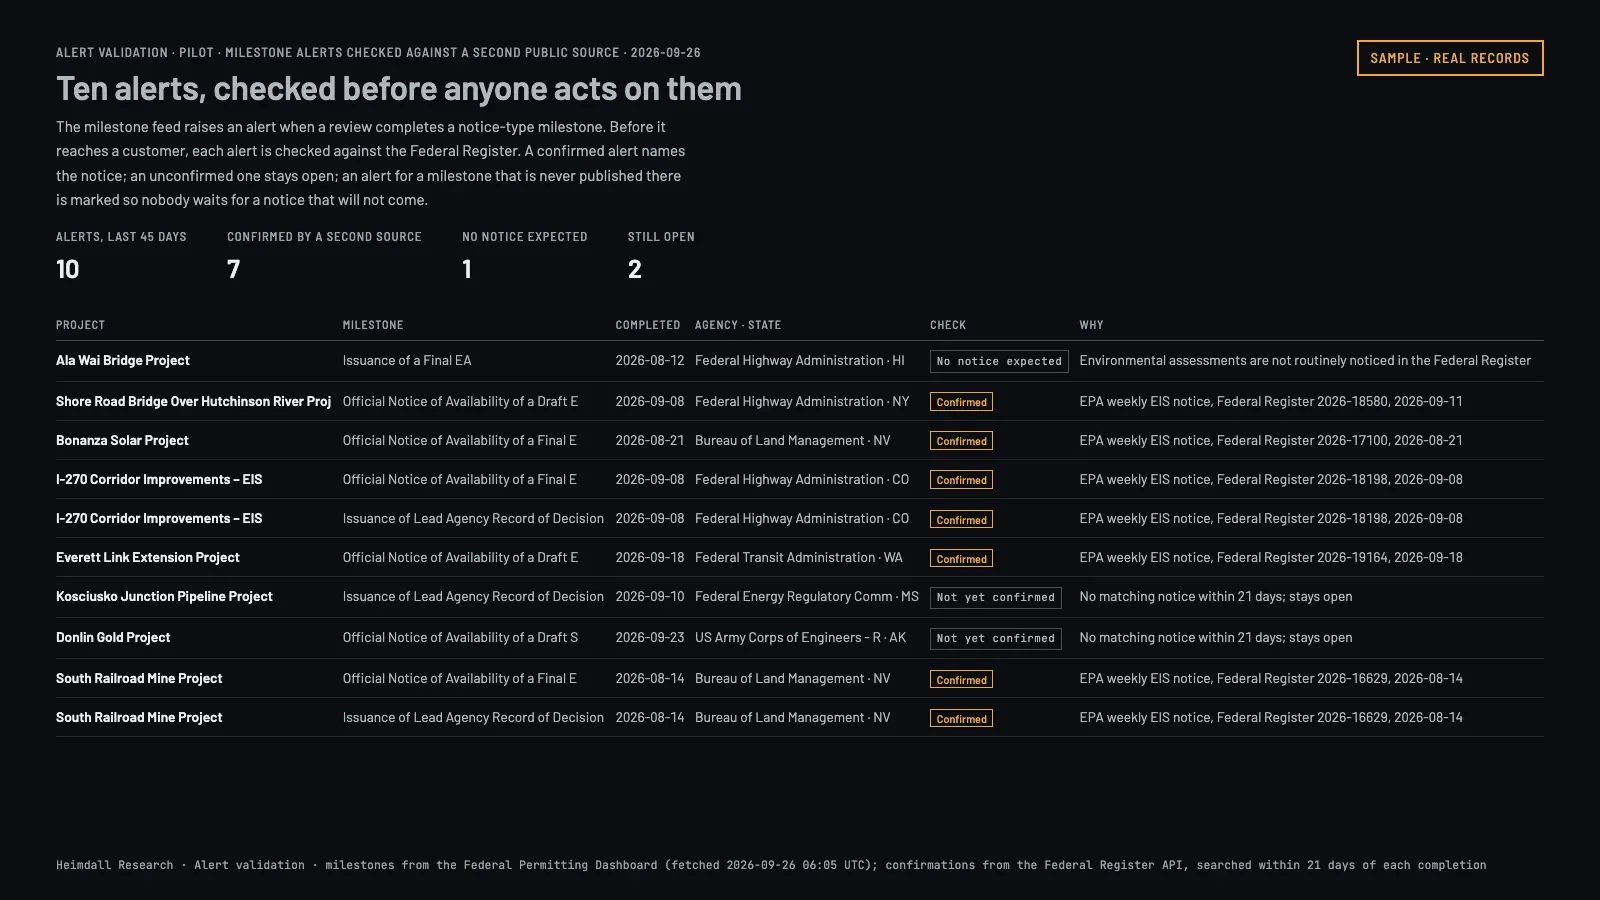
Compare automated change alerts against an agreed reference set, so you can see which real changes get caught and how often the system raises a false alarm.
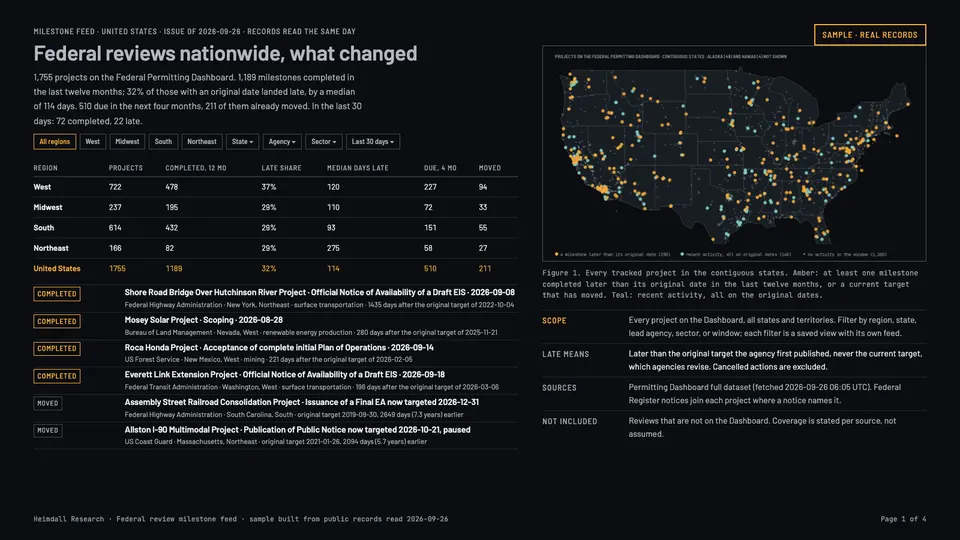
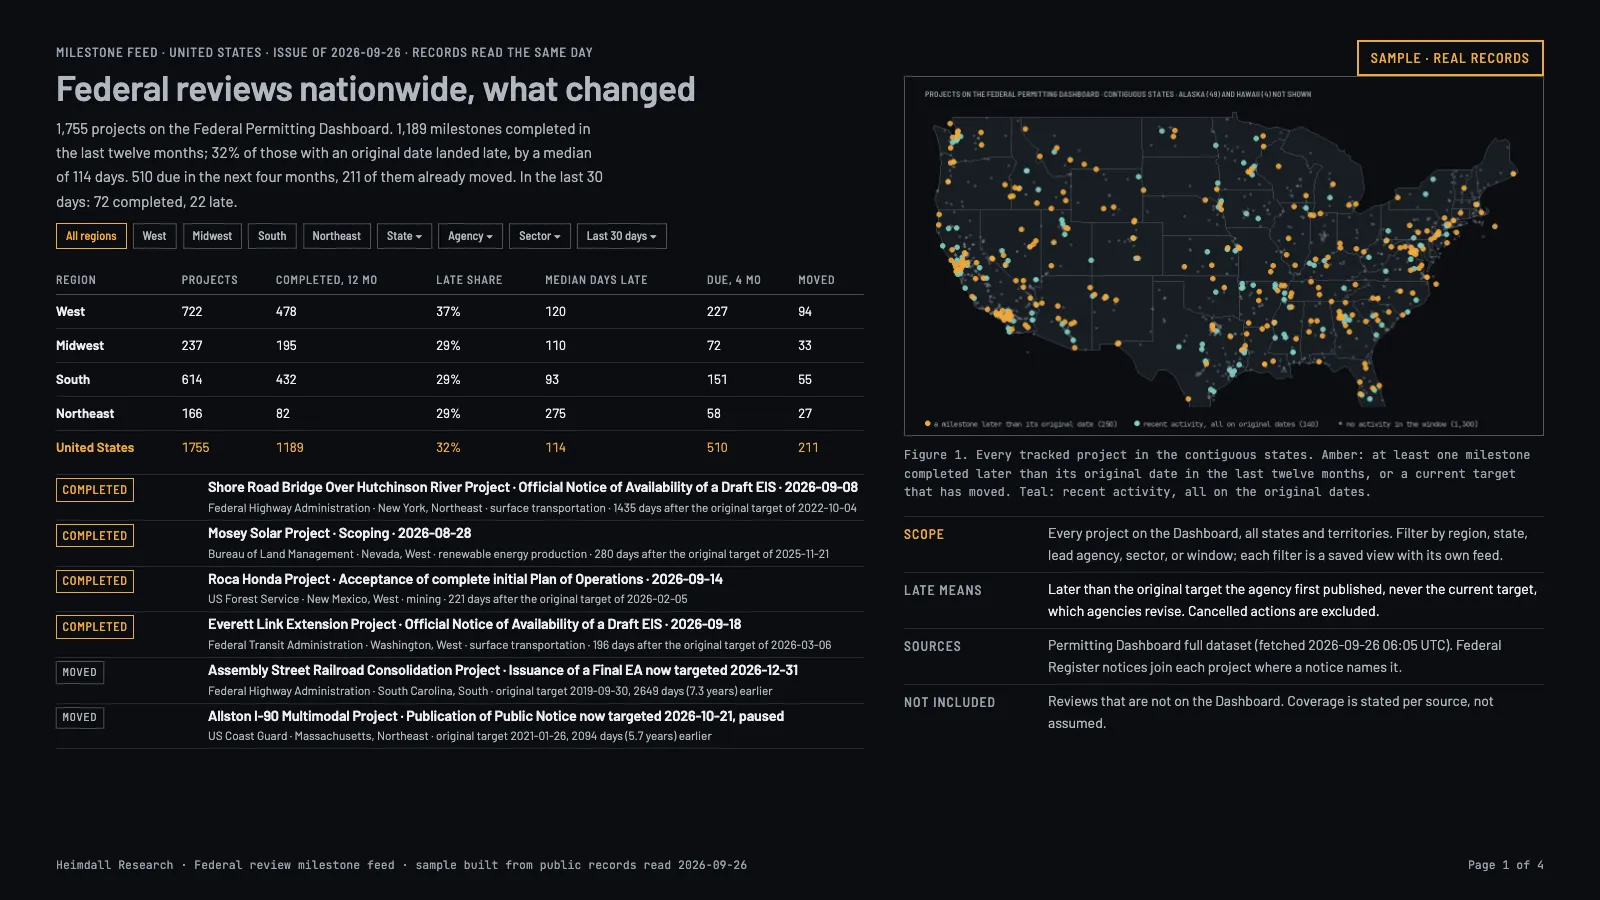
A sample set of milestone notices from 26 September 2026, checked against the Federal Register. Planned: Federal review milestone feed. Select to open.
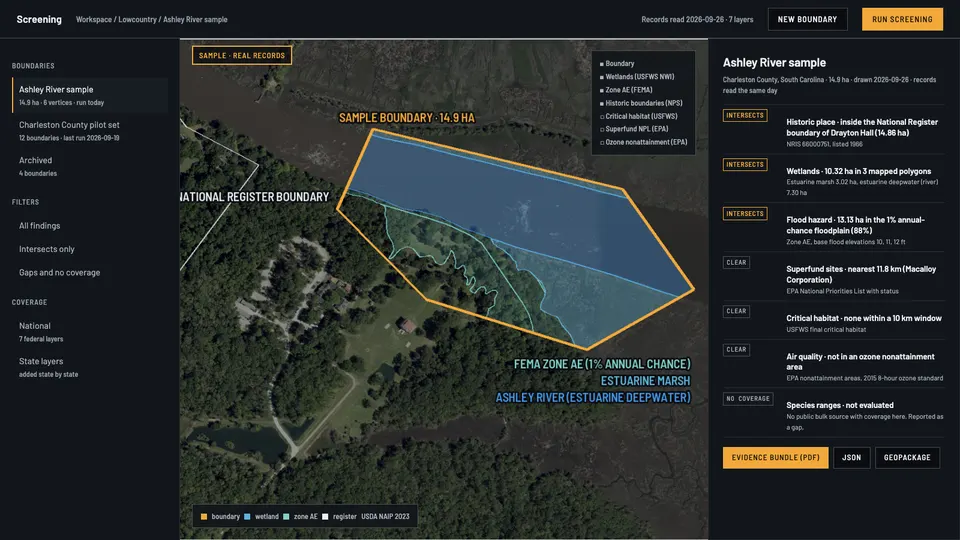
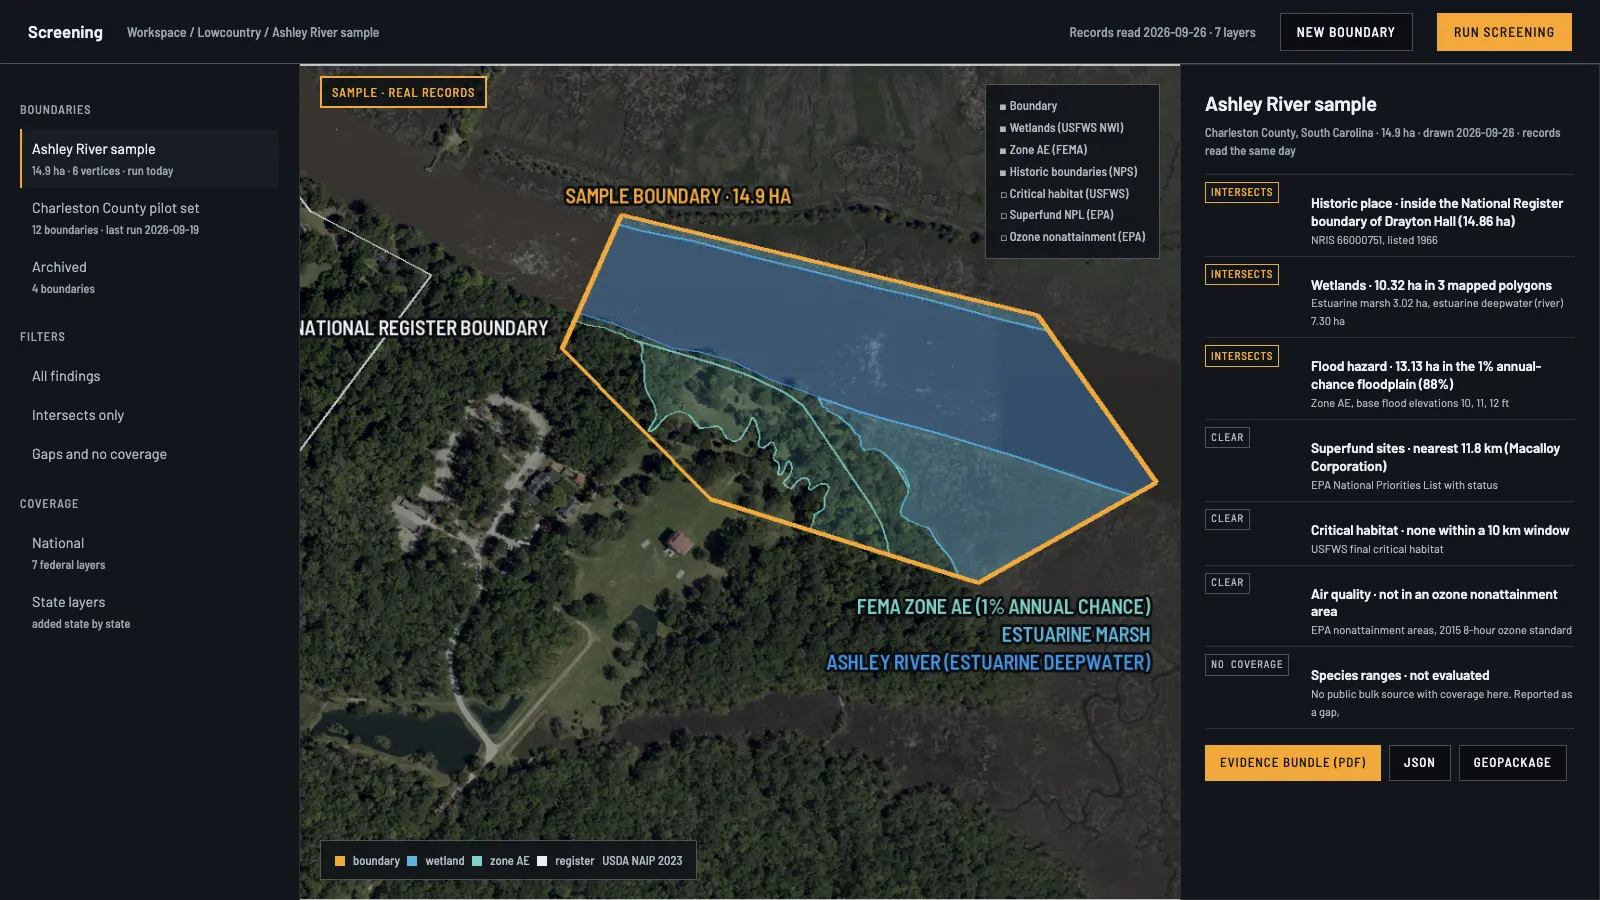
Production systems$25,000-$250,000+Build a maintained system that people use to do their actual work.From the example "Environmental screening application". Real records in an application frame: the Ashley River sample as a customer would see it.
Putting an application, an interface, a data feed, or a mapping workflow into daily use.
Scope
Application development, spatial databases, ingestion pipelines, analysis services, integration with your systems, sign-in and permissions, reporting, deployment, testing, and documentation.
You get
The agreed system, its deployment setup, acceptance test results, user and technical documentation, and either a handover or a support plan.
Timeline
One to six months. Longer for systems with many integrations or strict deployment requirements.
You provide
Authorized access to the data, technical contacts, user requirements, deployment requirements, and someone who can sign off on acceptance.
Price drivers
Number of integrations, complexity of the application, data volume, number of user roles, security requirements, and what has to happen when something breaks.
Not included
Ownership, licensing, hosting responsibility, support, and change requests are set in the written agreement. Delivering a system does not mean unlimited maintenance afterwards.
Illustrative engagement
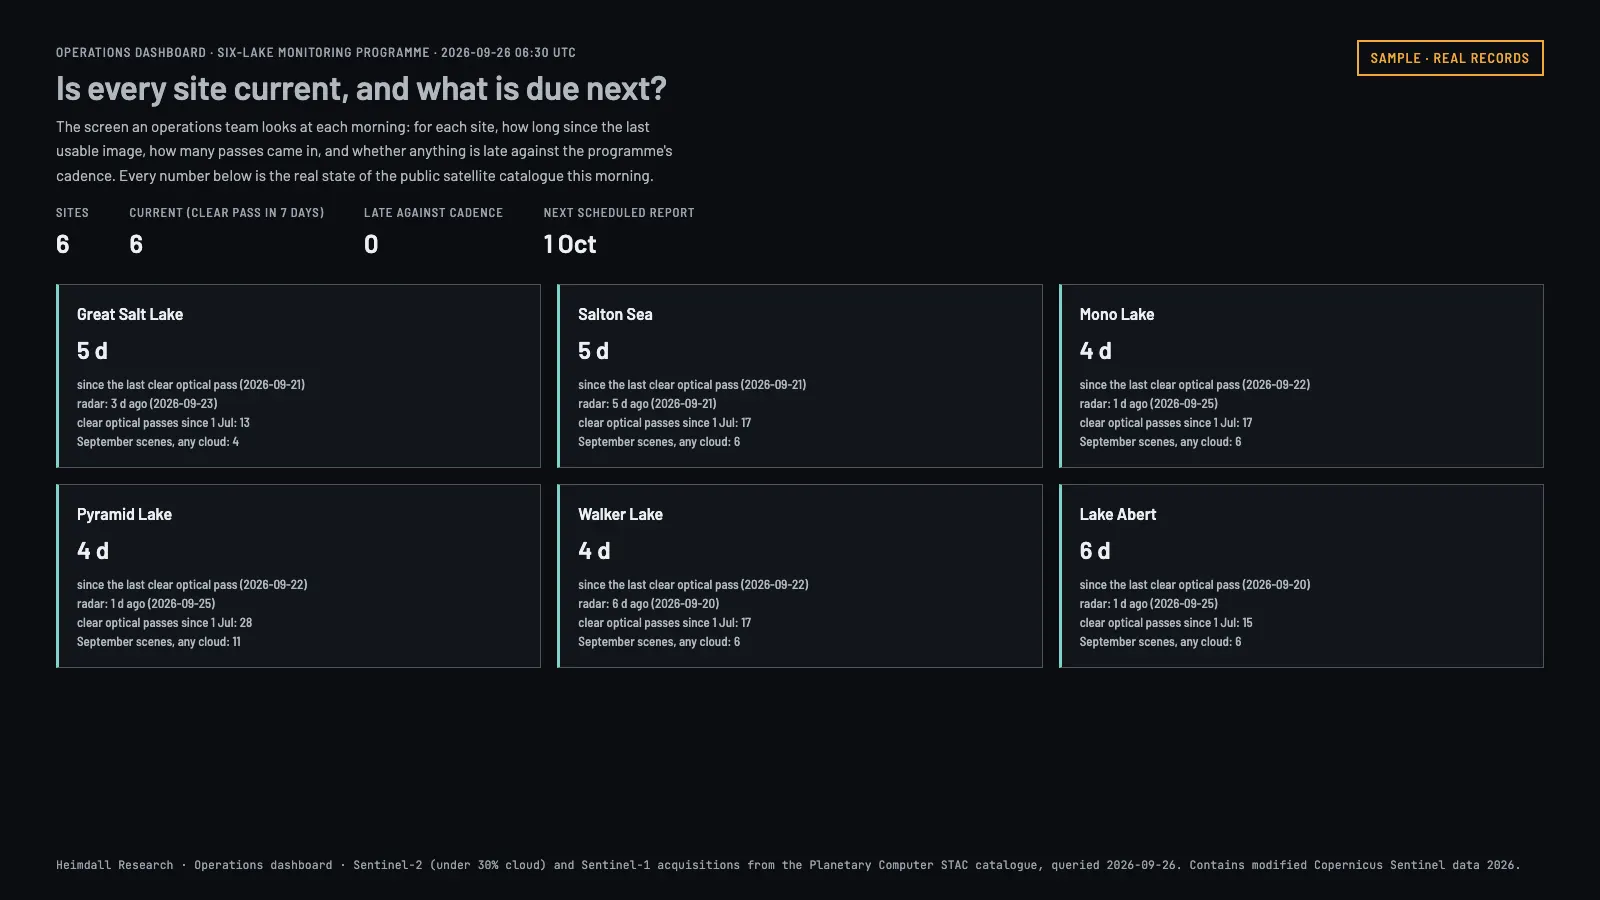
Operations dashboard
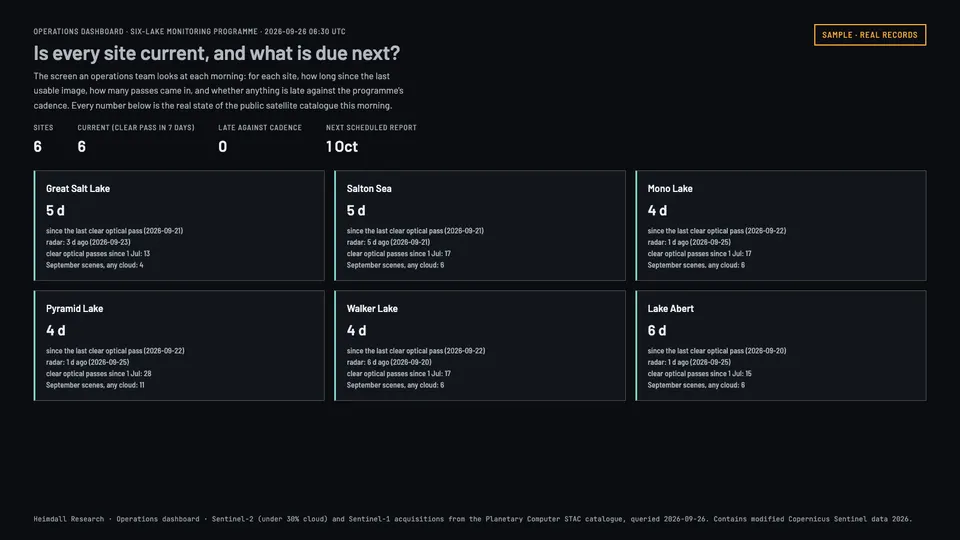
Bring sites, observations, and review tasks onto one screen: a searchable map, a page for each site, and exports the rest of the business can use.
Real state of the satellite catalog over six lakes on the morning of 26 September 2026. Select to open.
Illustrative engagement
Environmental screening application
Turn a project boundary into a structured report where every finding links back to the document or dataset it came from, so a reviewer can check the work.
Pictured at the top of this section.
Illustrative engagement
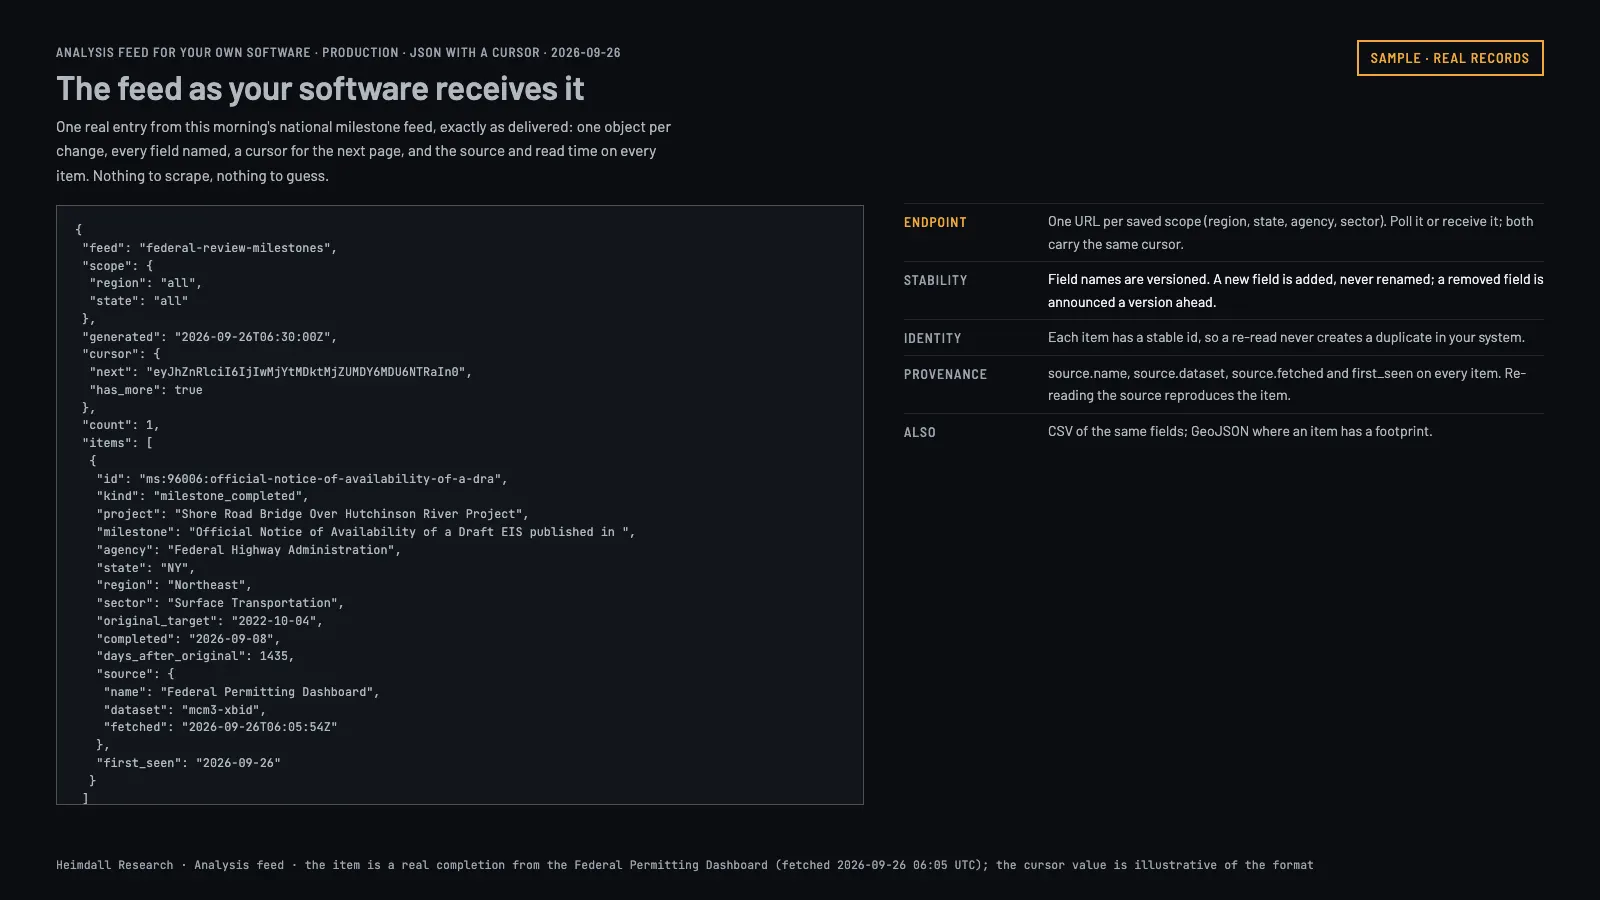
Analysis feed for your own software
Connect analysis results into an application your team already runs, with documented inputs, structured responses, sign-in, and worked integration examples.
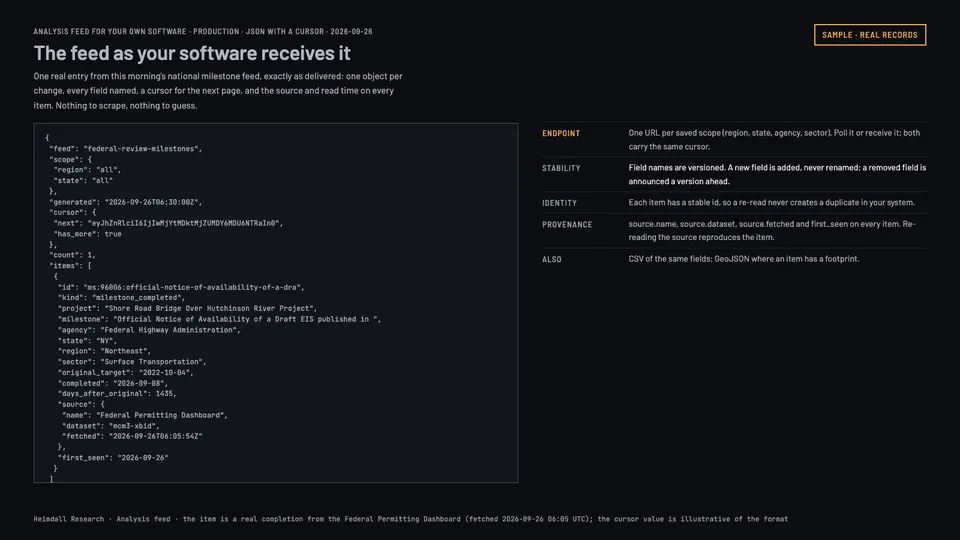
Enterprise and multi-site programs$100,000-$500,000+Run the same analysis across many locations, teams, and systems, rolled out in stages.The national issue of the Federal review milestone feed, every project on the Federal Permitting Dashboard on 26 September 2026.
Organizations with assets spread across regions, several departments involved, or a rollout that has to happen in phases.
Scope
Analysis across regions, integration with an organization-wide mapping system, several data sources, shared access control, historical analysis, reporting, workflow automation, and staged deployment.
You get
A phased implementation, the agreed integrations, working procedures, training, documentation, acceptance testing, and a plan for keeping it running.
Timeline
Three to twelve months, sometimes longer.
You provide
Decision-makers and technical contacts, a list of sites, access requirements, rollout priorities, and the governance decisions that come with them.
Price drivers
Geographic scope, number of sites, how often data refreshes, number of user groups, integration depth, security requirements, and ongoing operations.
Not included
Staffing levels, throughput, continuity, and service commitments are agreed in writing. Nothing on this page should be read as a commitment to any of them.
Illustrative engagement
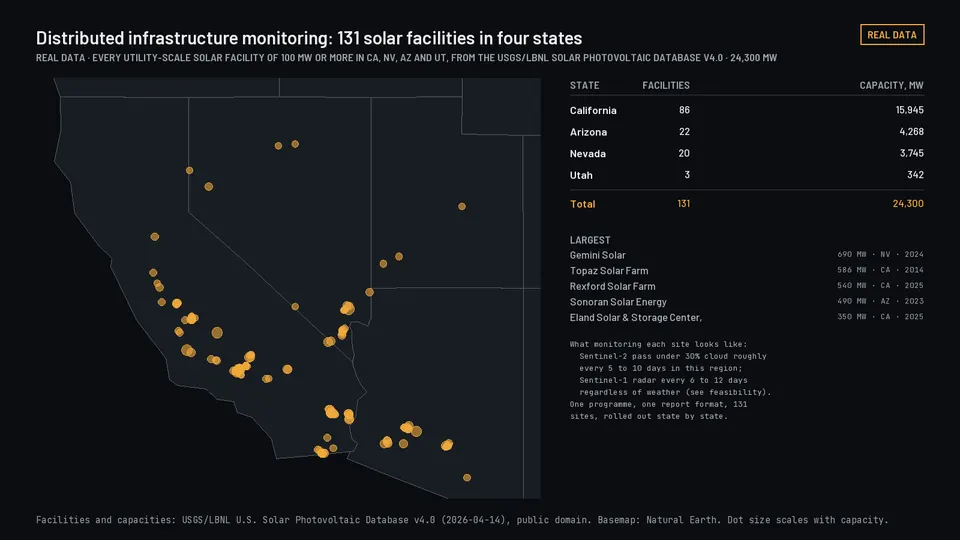
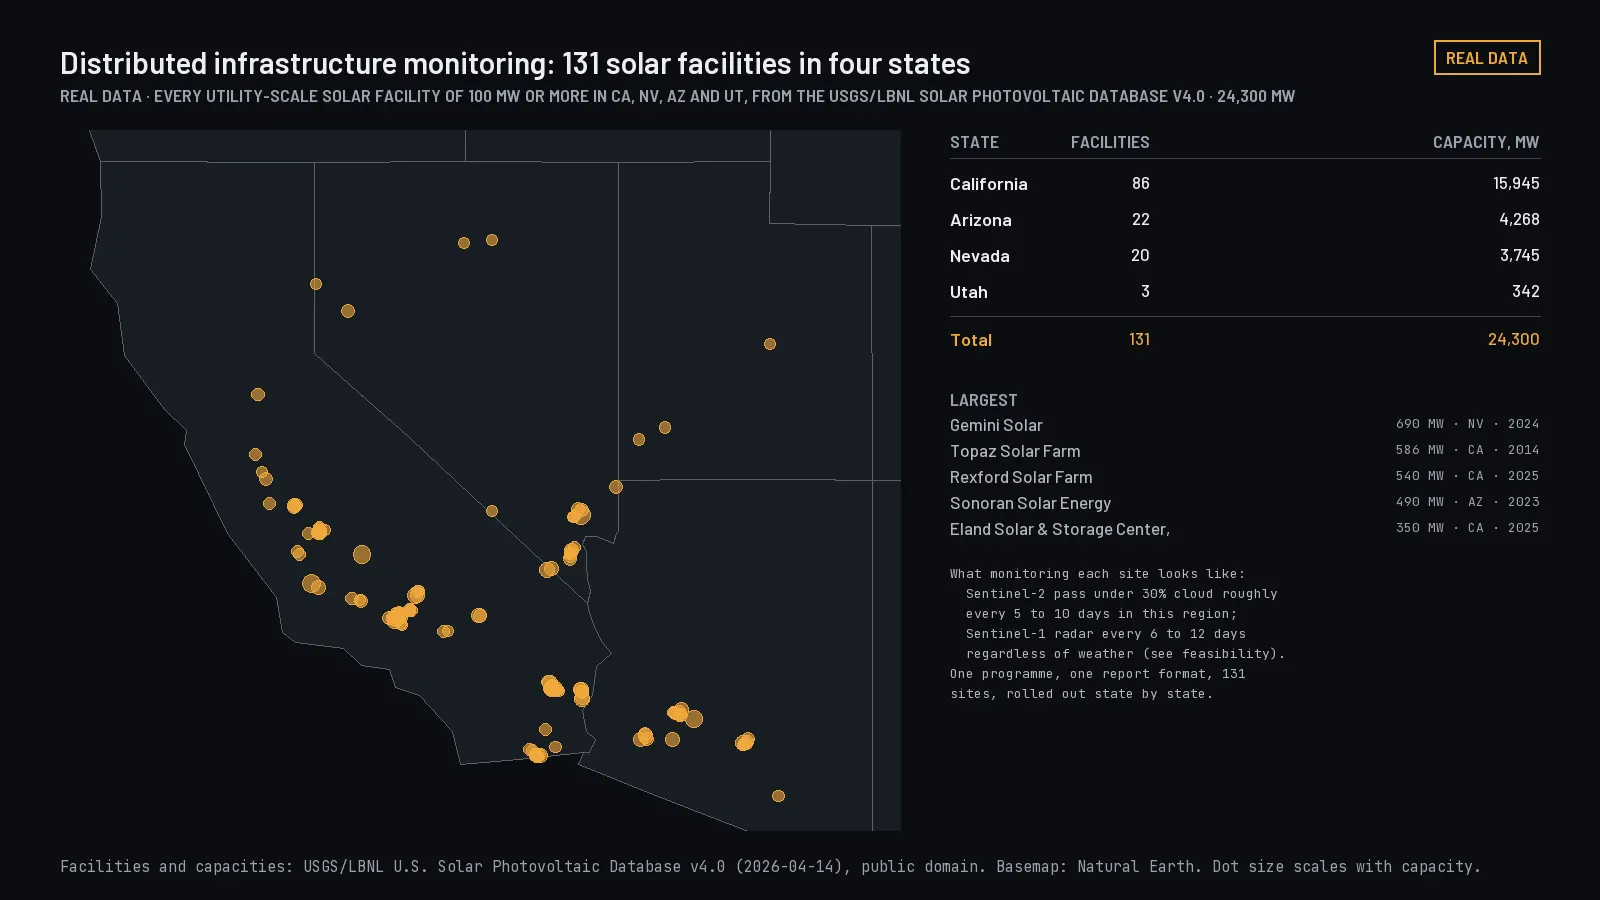
Distributed infrastructure monitoring
A coordinated way to watch a large portfolio: a portfolio map, a prioritized review queue, a history for each site, and reporting on a fixed schedule.
Real portfolio: every solar facility of 100 MW or more in four states, from the federal facility database. Planned: Portfolio monitoring. Select to open.
Illustrative engagement
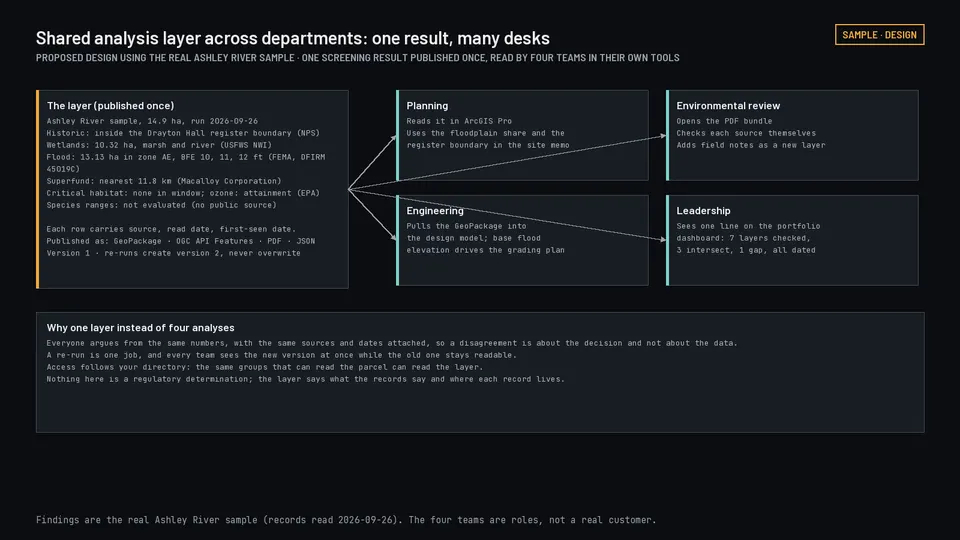
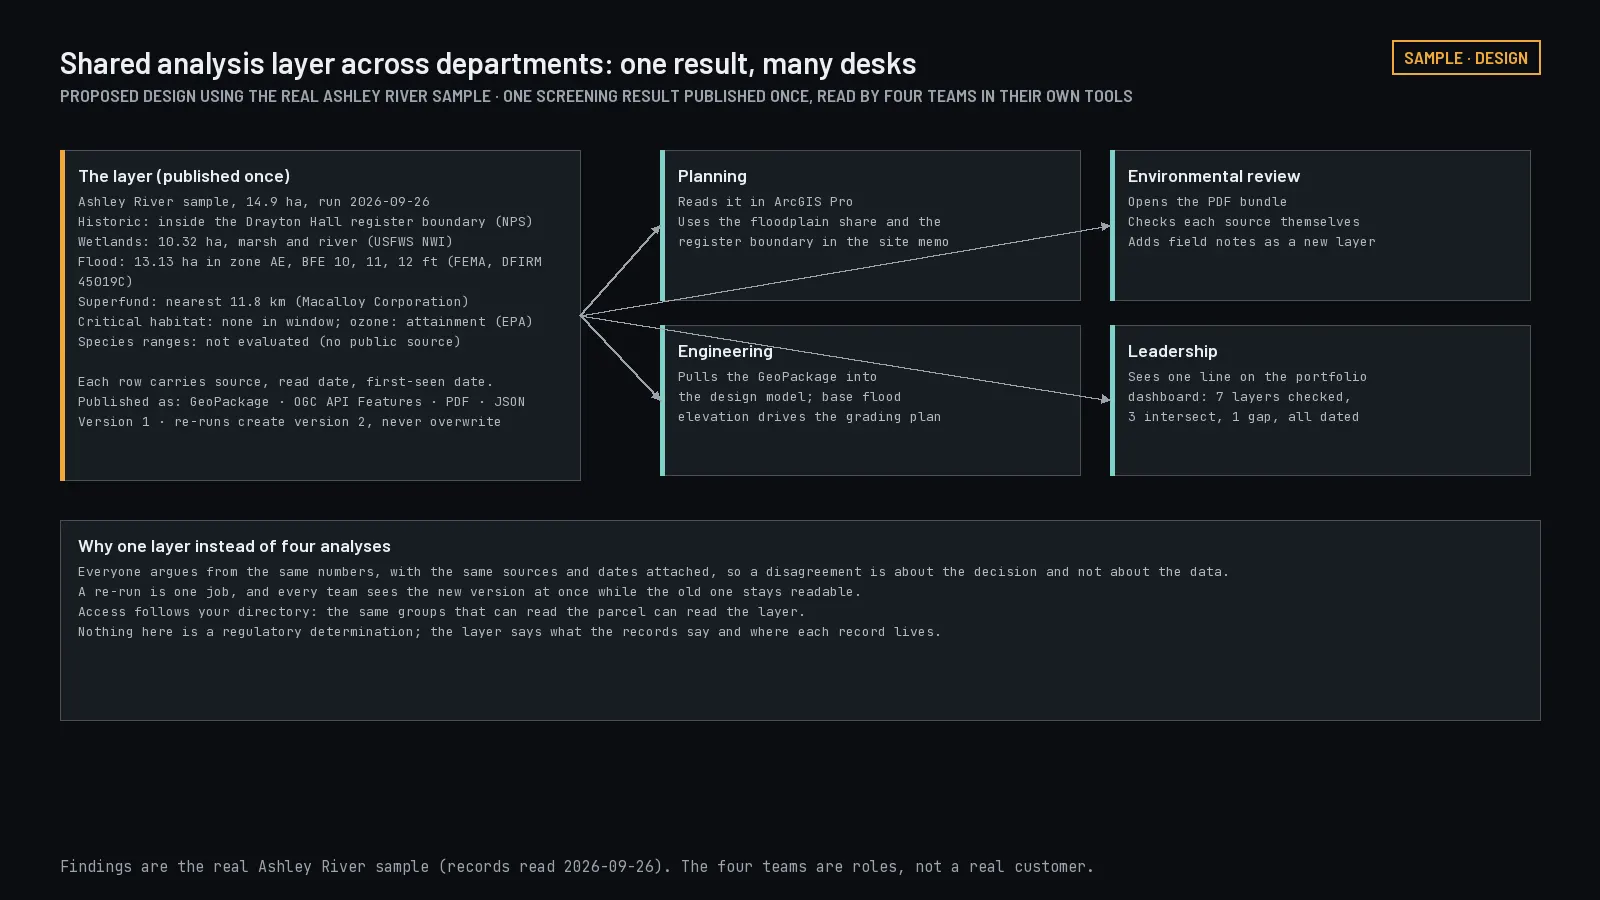
Shared analysis layer across departments
Planning, operations, engineering, and environmental teams all working from the same analytical results, each inside the tools they already use.
Proposed design using the real Ashley River result: one layer, four desks. Select to open.
Illustrative engagement
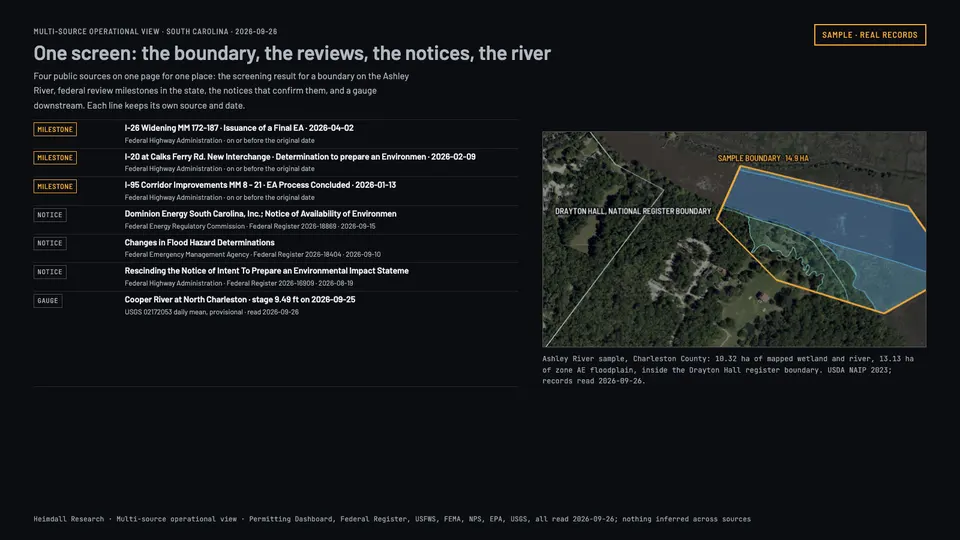
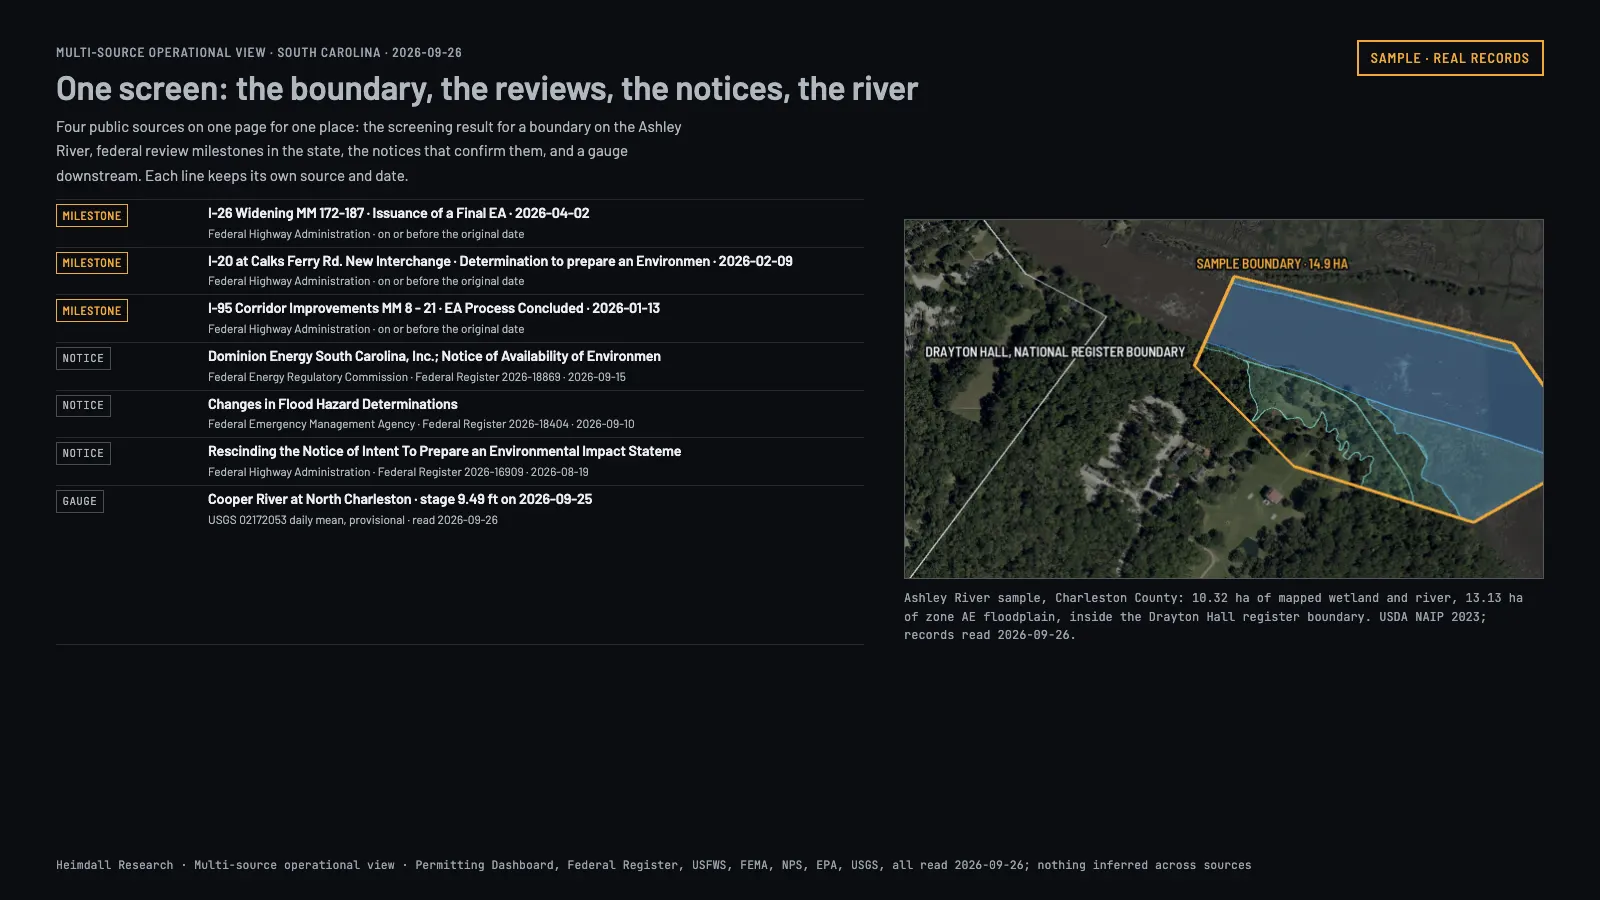
Multi-source operational view
Combine satellite observations with your own authorized operational records, so one view shows both and every output can be traced back to its source.
Real records from four sources on one page for one place in South Carolina. Select to open.
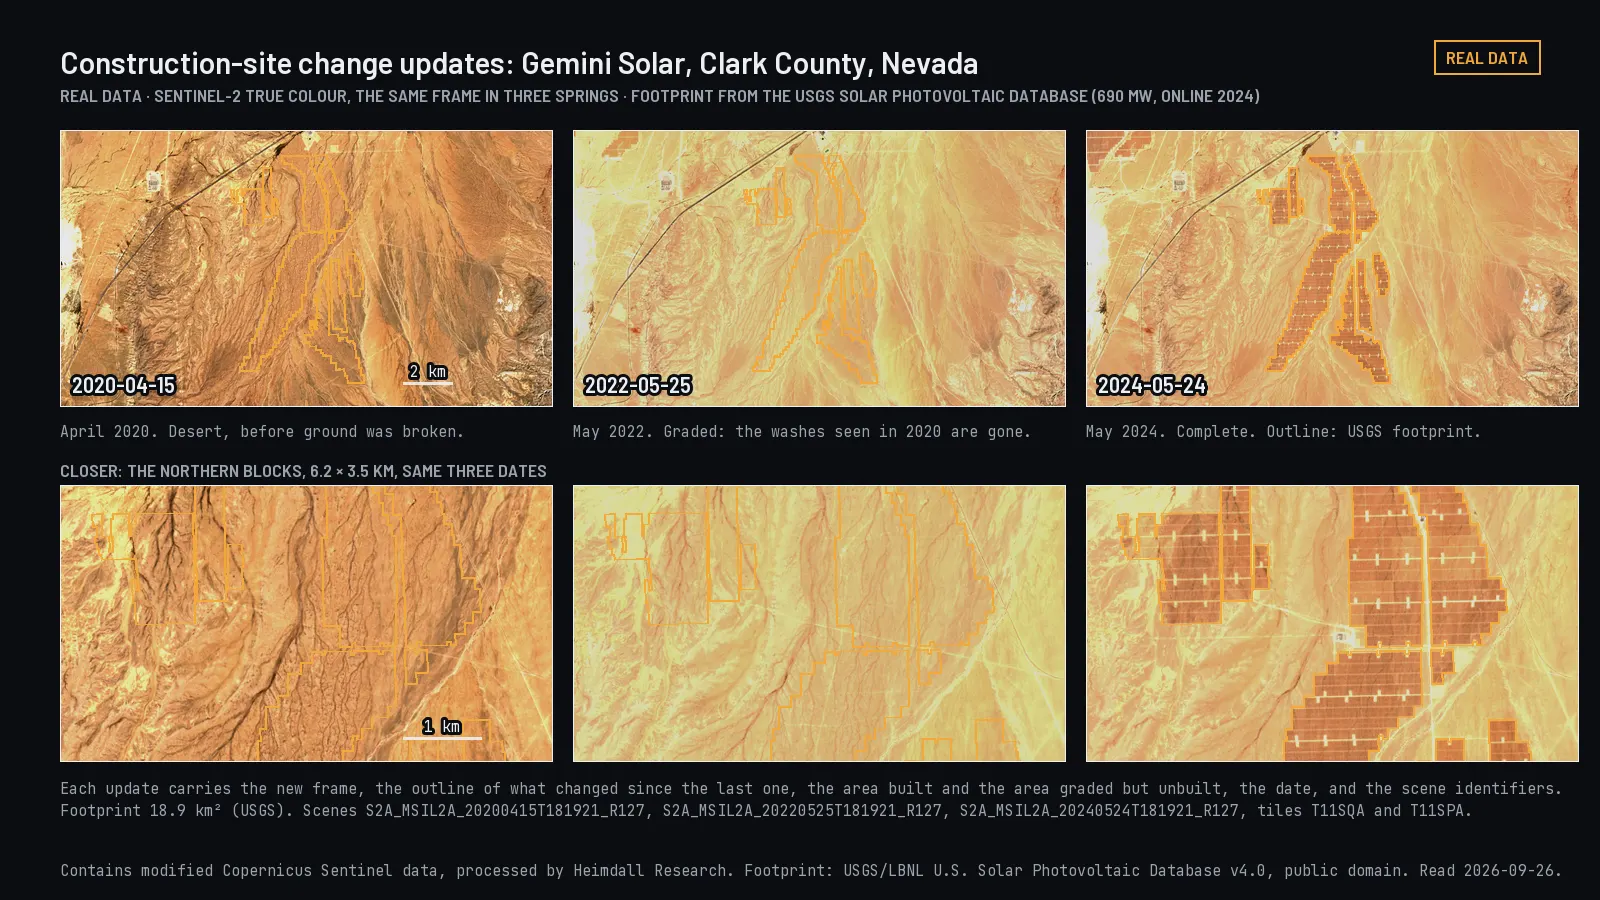
Managed monitoringFrom $7,500/monthRecurring observation, analysis, and updates for the places that matter to you.From the example "Construction-site change updates". The same Nevada site in three springs as a solar plant was built.
Sites that need continuing visibility beyond a single study.
Scope
Scheduled data collection, change analysis, quality checks, the agreed amount of human review, updated layers, and periodic reports.
You get
Updated map layers, observation summaries, change reports, items flagged for review, and delivery into your systems on the agreed schedule.
Schedule
Onboarding and the first baseline are scoped and priced separately. Observation and delivery schedules are set in the agreement.
You provide
The locations or boundaries, what kind of change matters, your reporting needs, who to escalate to, and which limits are acceptable.
Price drivers
Area, number of sites, resolution, how often you need an update, imagery costs, how much human review is involved, integrations, and how long data is kept.
Not included
Satellite collection, data availability, processing, and report delivery are separate steps. We do not promise daily coverage everywhere.
Illustrative engagement
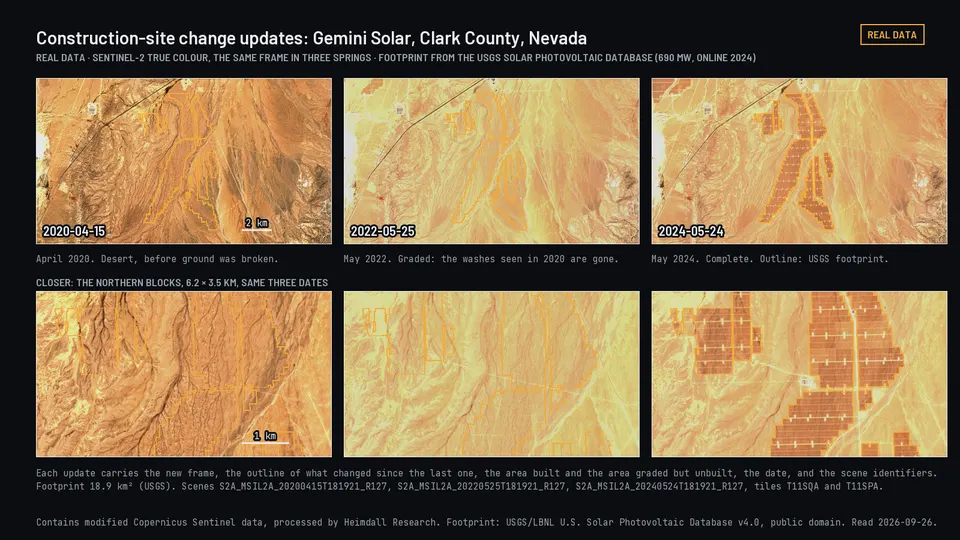
Construction-site change updates
Recurring observations of visible change on a site, with the limits of what the imagery can and cannot show stated each time.
Pictured at the top of this section.
Illustrative engagement
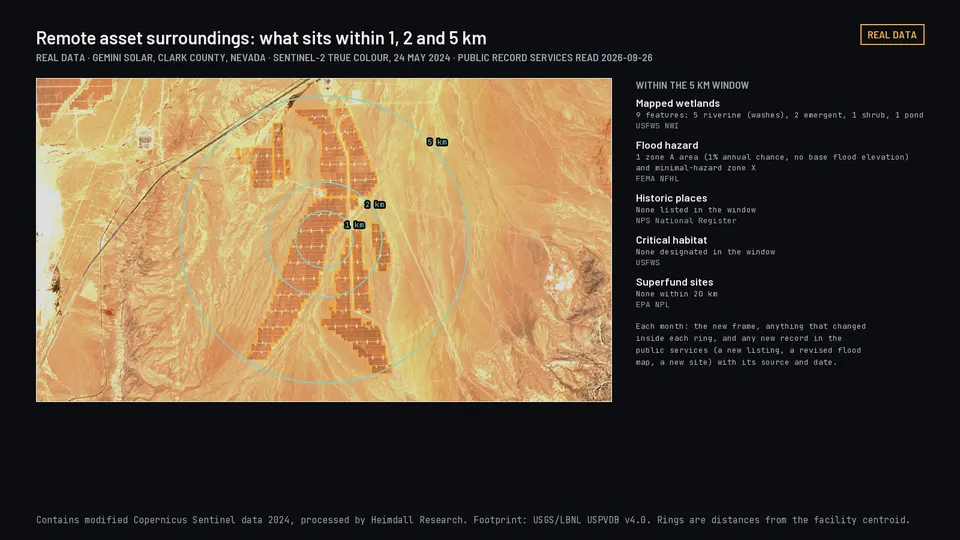
Remote asset surroundings
Review of change within an agreed area around infrastructure or remote property, where sending someone to look is slow and expensive.
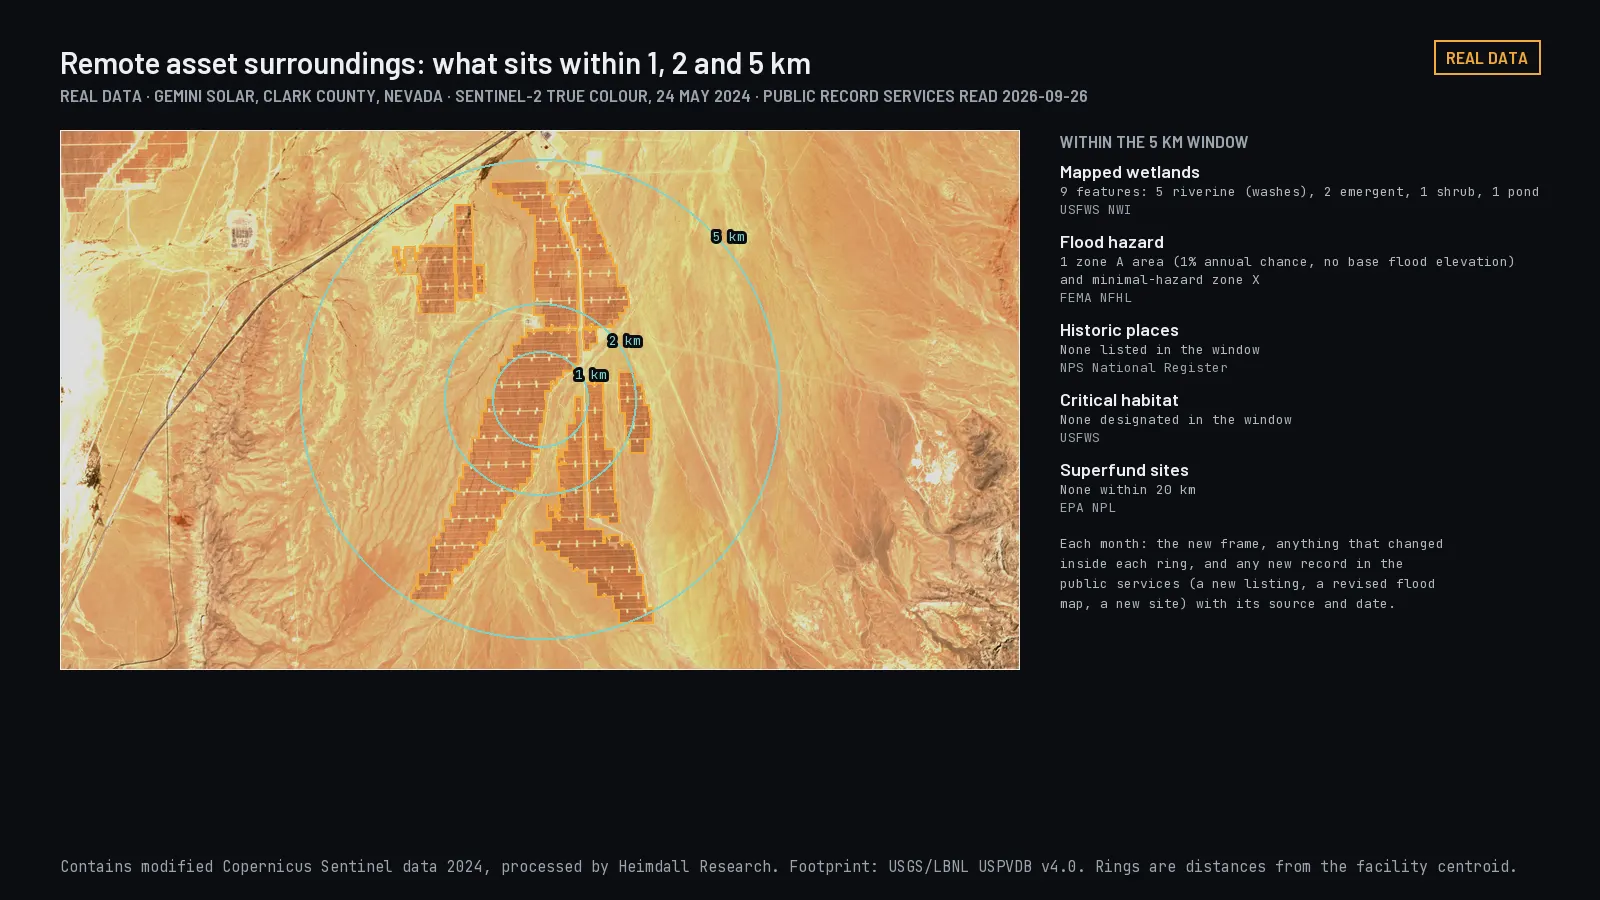
Real records within 1, 2, and 5 km of a Nevada solar plant. Select to open.
Illustrative engagement
Environmental trend tracking
One defined indicator, such as water extent or vegetation condition, tracked through time with source and quality information attached to every value.
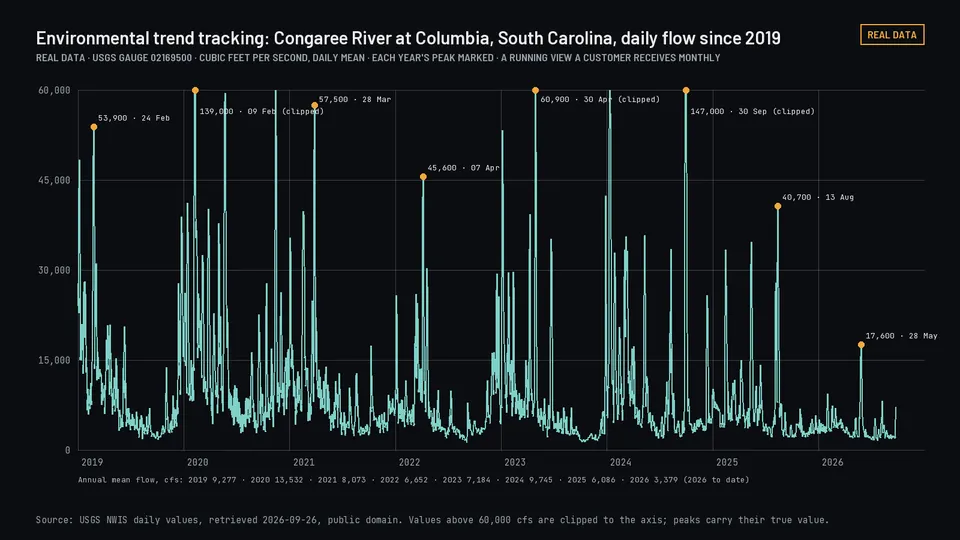
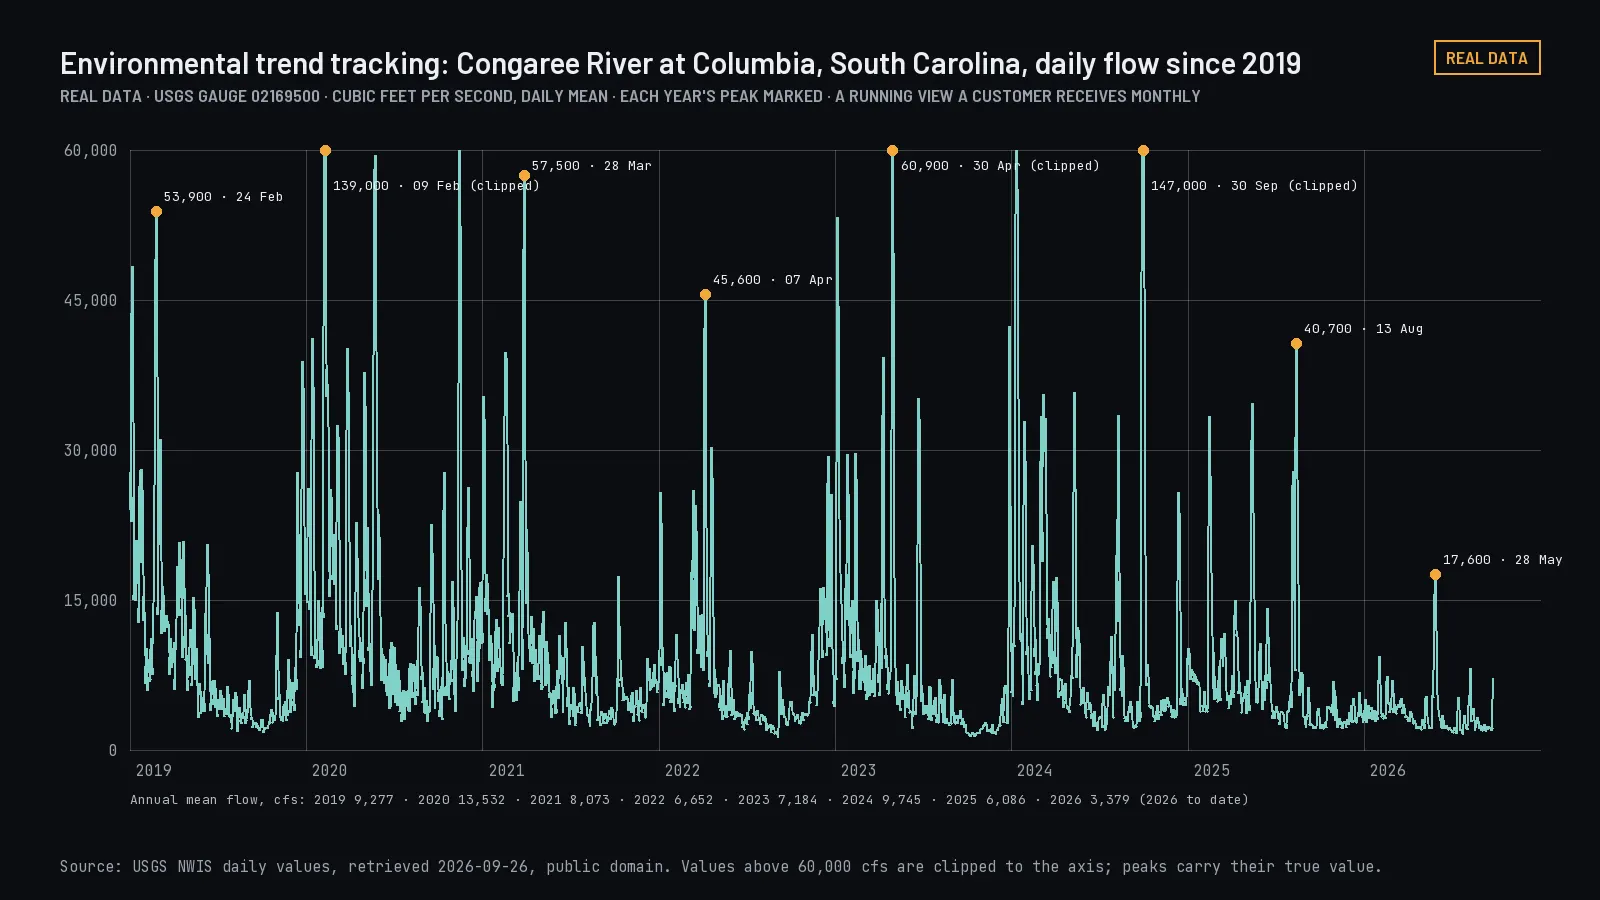
Congaree River daily flow since 2019 from a federal stream gauge. Planned: Water observation histories. Select to open.
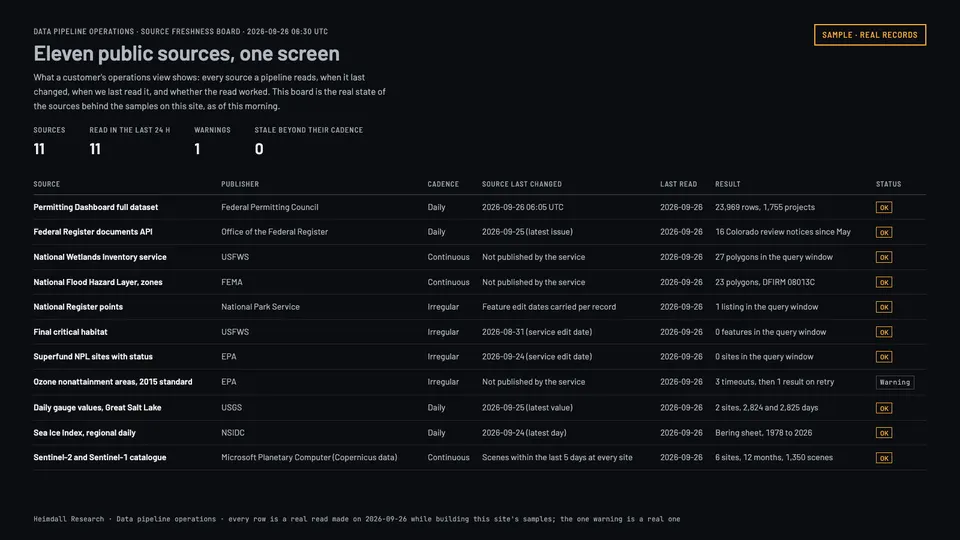
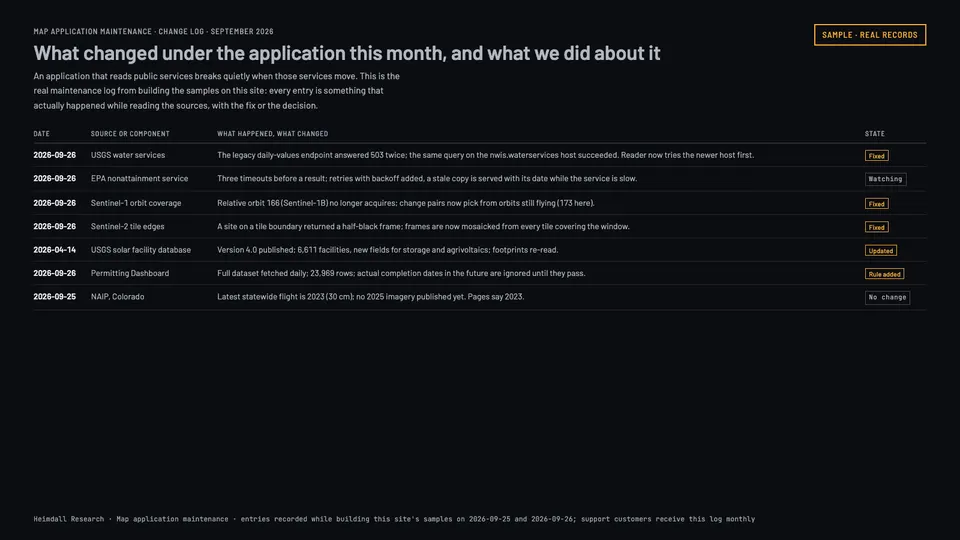
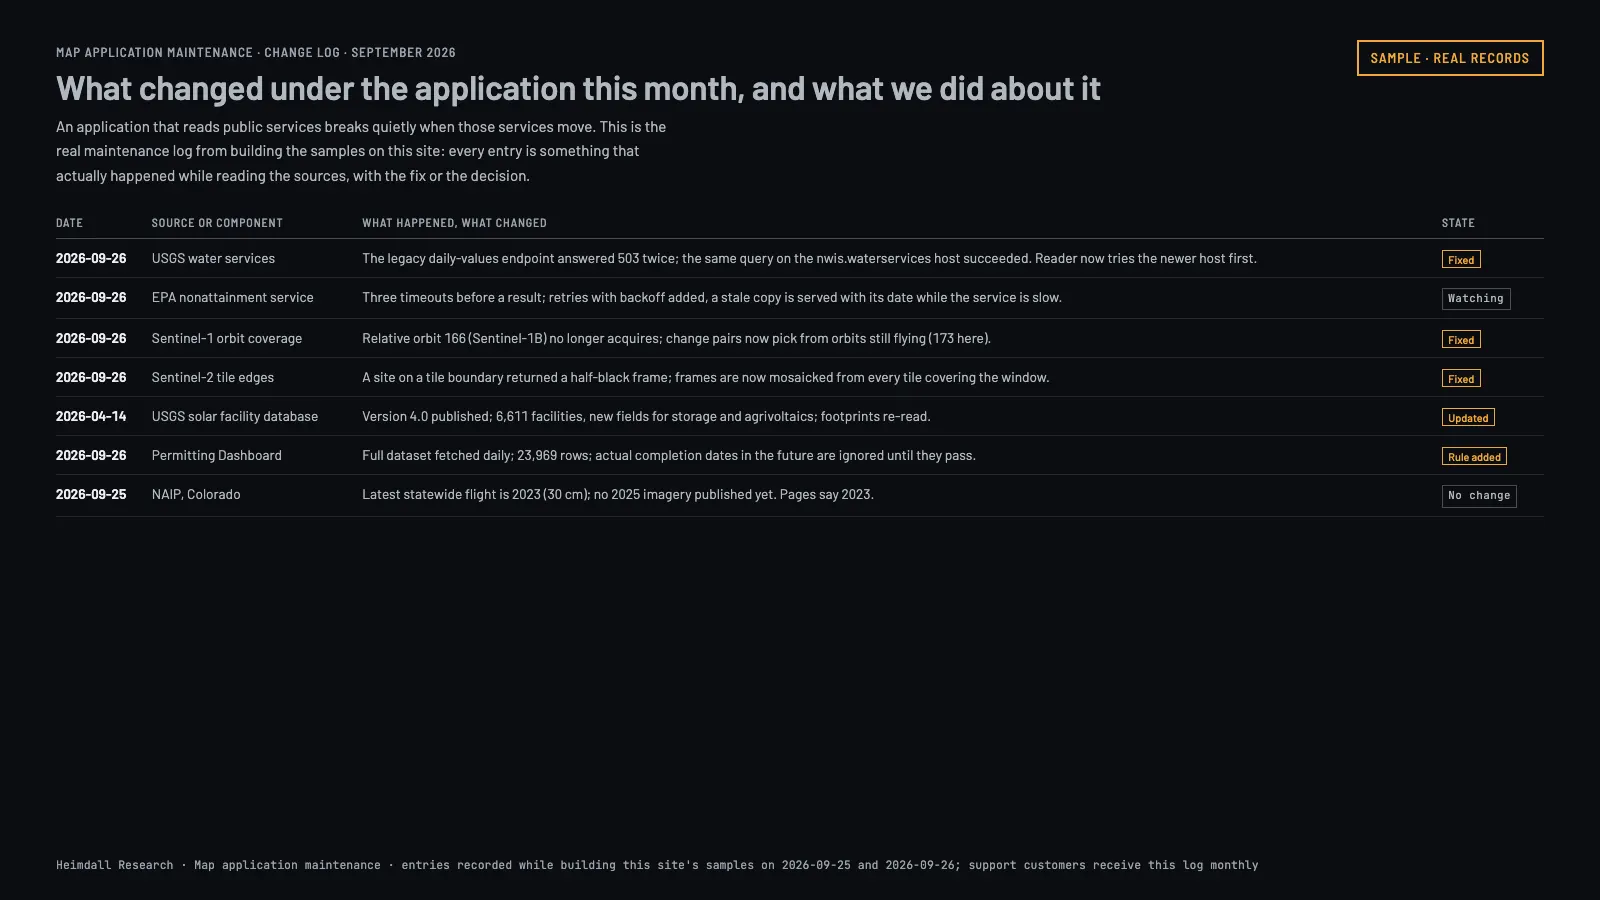
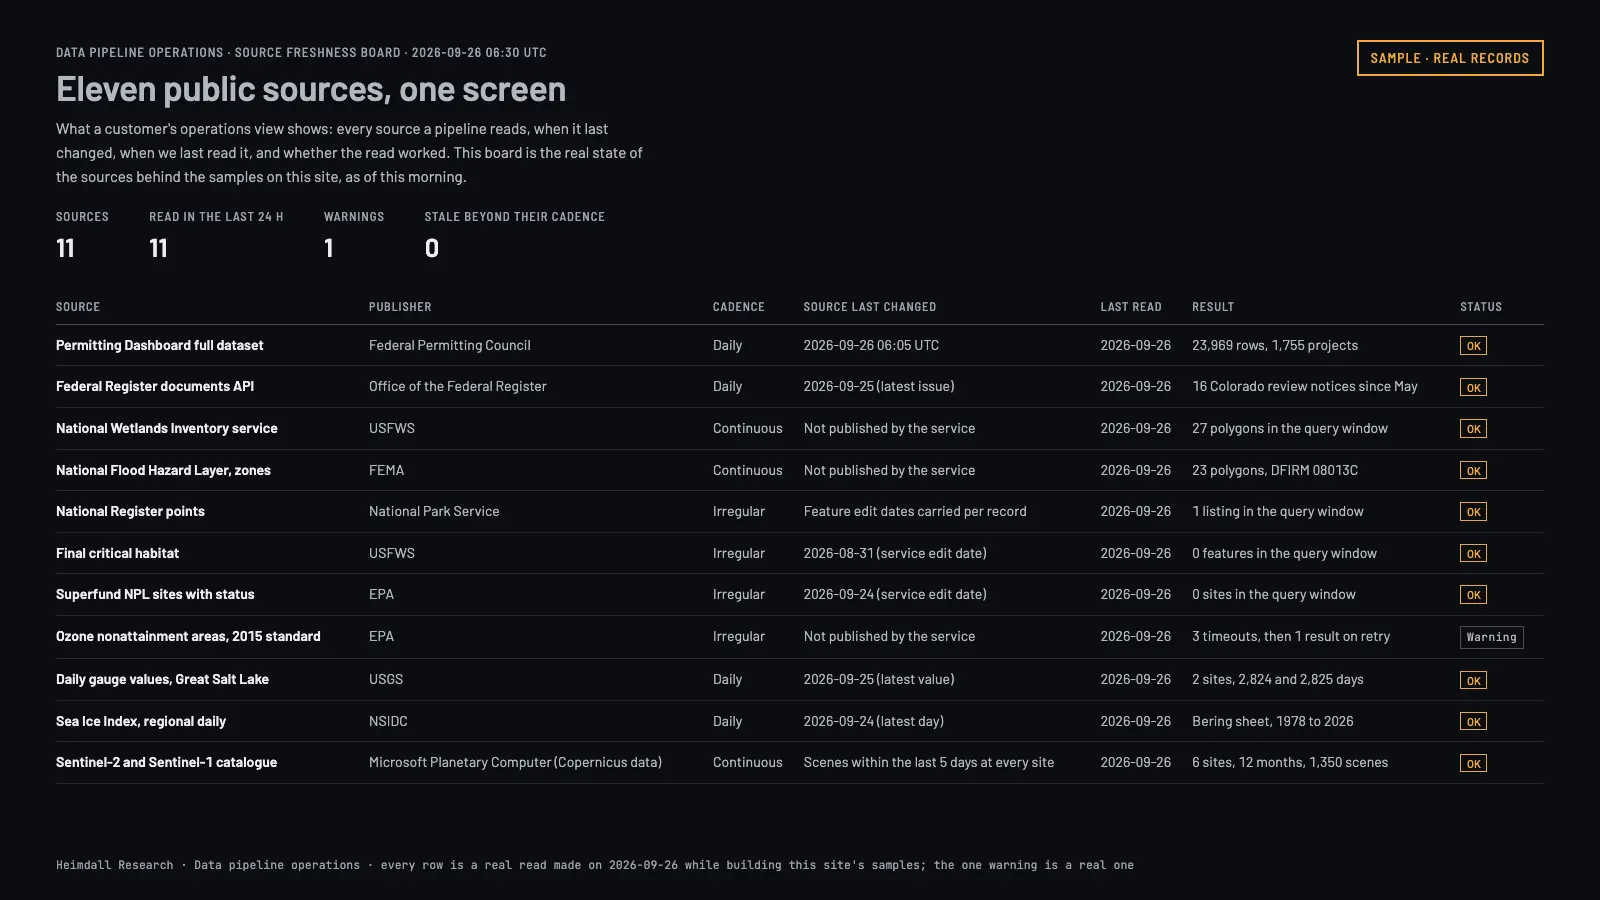
Engineering and supportFrom $3,500/monthKeep a system that already exists working, supported, and current.From the example "Data pipeline operations". Real reads: the eleven public sources behind this site's samples, as they stood on 26 September 2026.
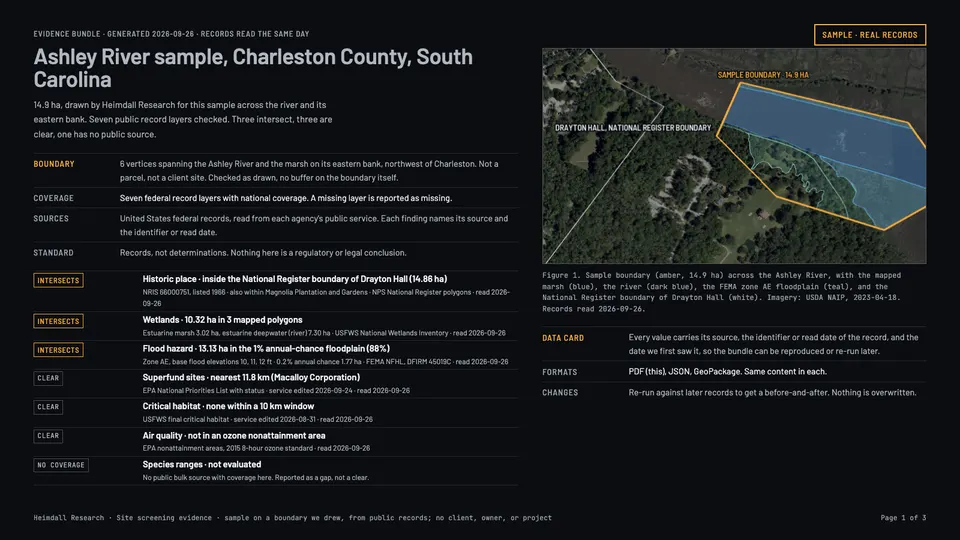
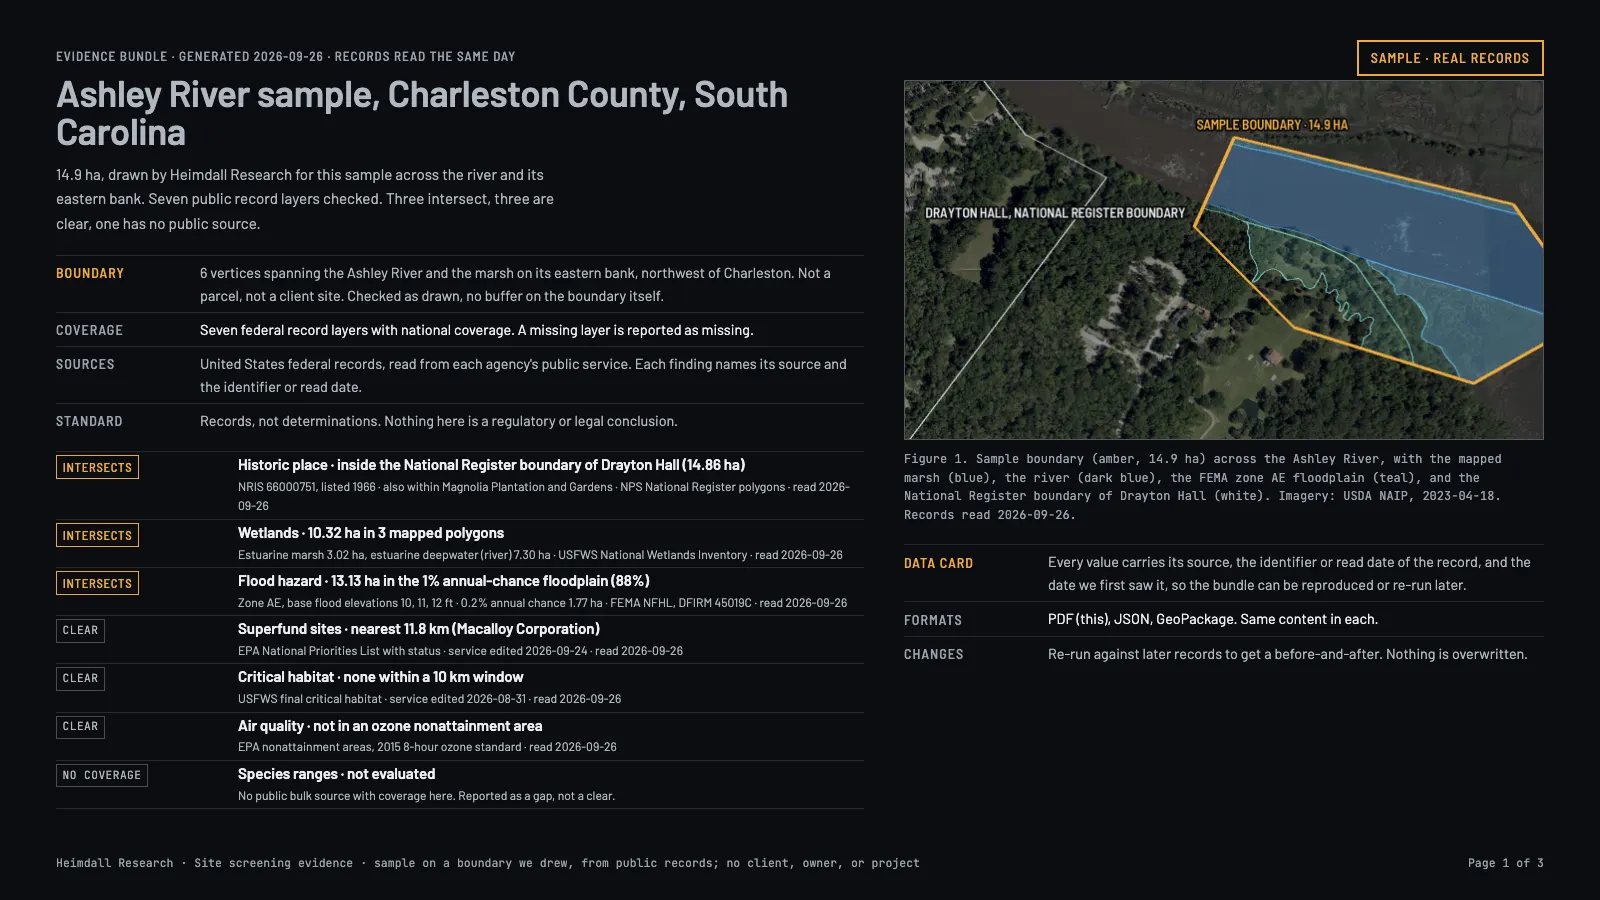
Government and complex programsCustomWork where procurement, deployment, or assurance requirements shape the engineering as much as the problem does.The first page of a Site screening evidence bundle for the Ashley River sample, in the form a reviewer receives.
Public agencies, research institutions, prime contractors, and regulated buyers with requirements that come before the technical work.
Scope
Custom geospatial systems, research programs, mapping modernization, controlled deployment, provenance, testing, documentation, and support over a long period.
You get
Whatever the agreement defines: technical deliverables, documentation, an acceptance process, and a clear split of who is responsible for deployment.
Schedule
Set by procurement, access, approvals, and how complex the program is.
You provide
Procurement requirements, technical objectives, deployment constraints, data classifications, and the assurance evidence you need to see.
Price drivers
Scope, staffing, integration, documentation, security requirements, approvals, and duration.
Not included
We do not hold a facility clearance, a government certification, or an approved cloud authorization, and we will not imply otherwise. If your requirement depends on one, say so early and we will tell you whether we can meet it.
Illustrative engagement
Agency decision-support system
Bring authorized spatial and administrative records into one workflow where every result can be traced to the record it came from.
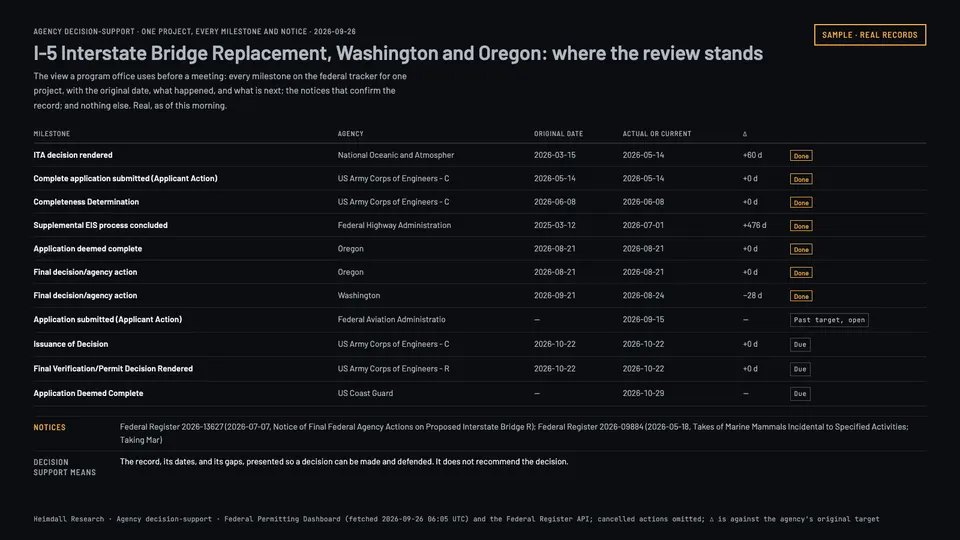
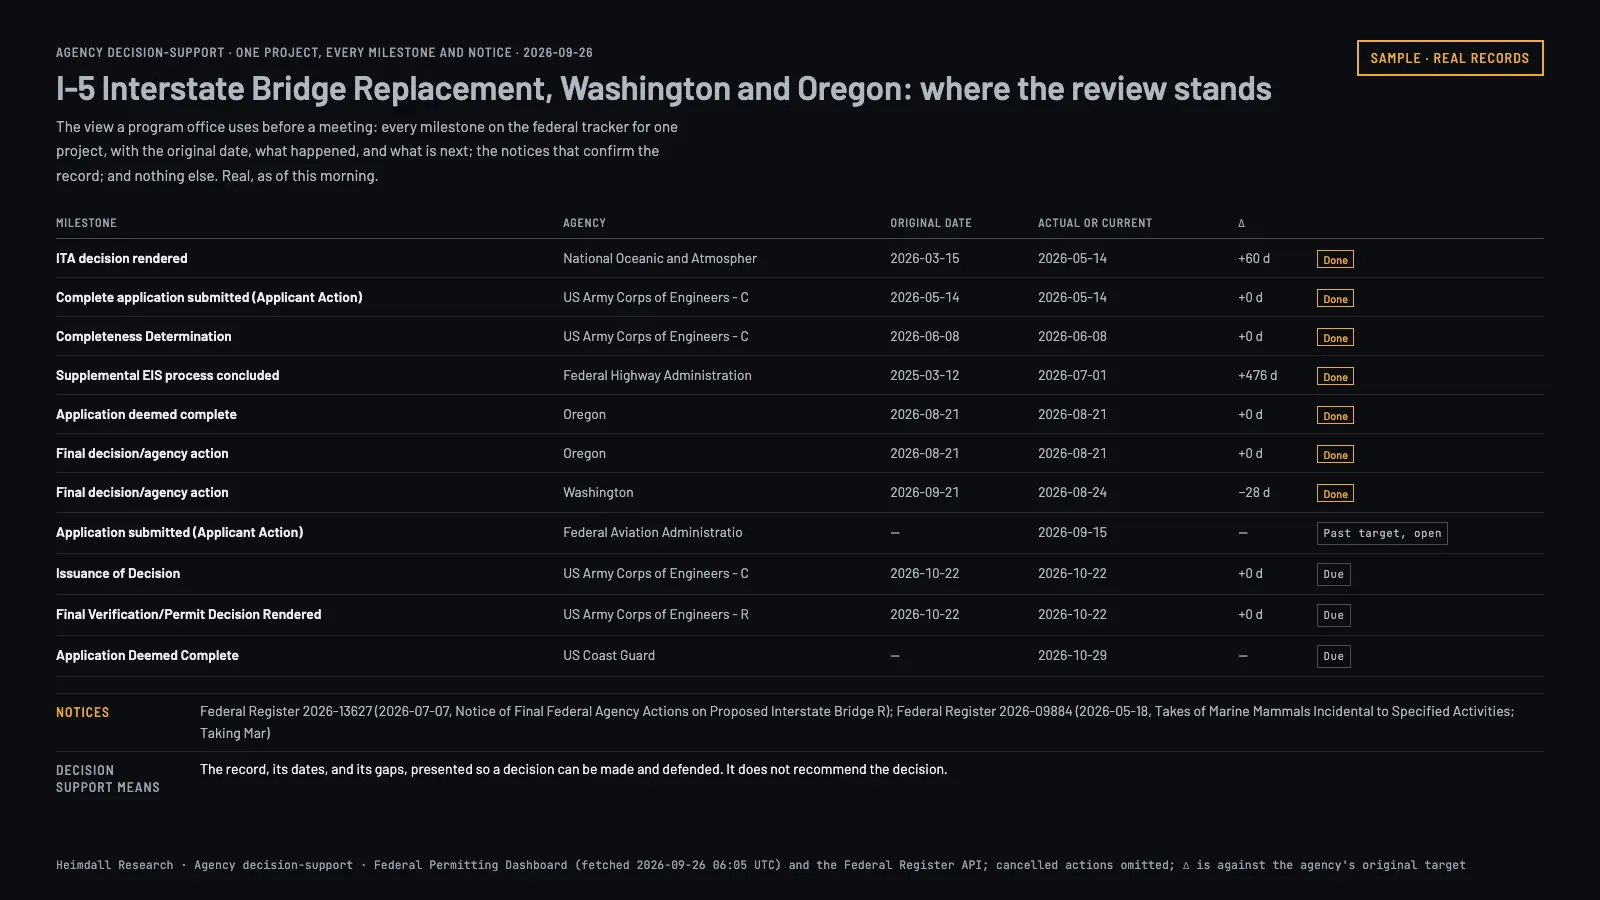
Real record of one federal review, every milestone and notice, as of 26 September 2026. Planned: Federal review milestone feed. Select to open.
Illustrative engagement
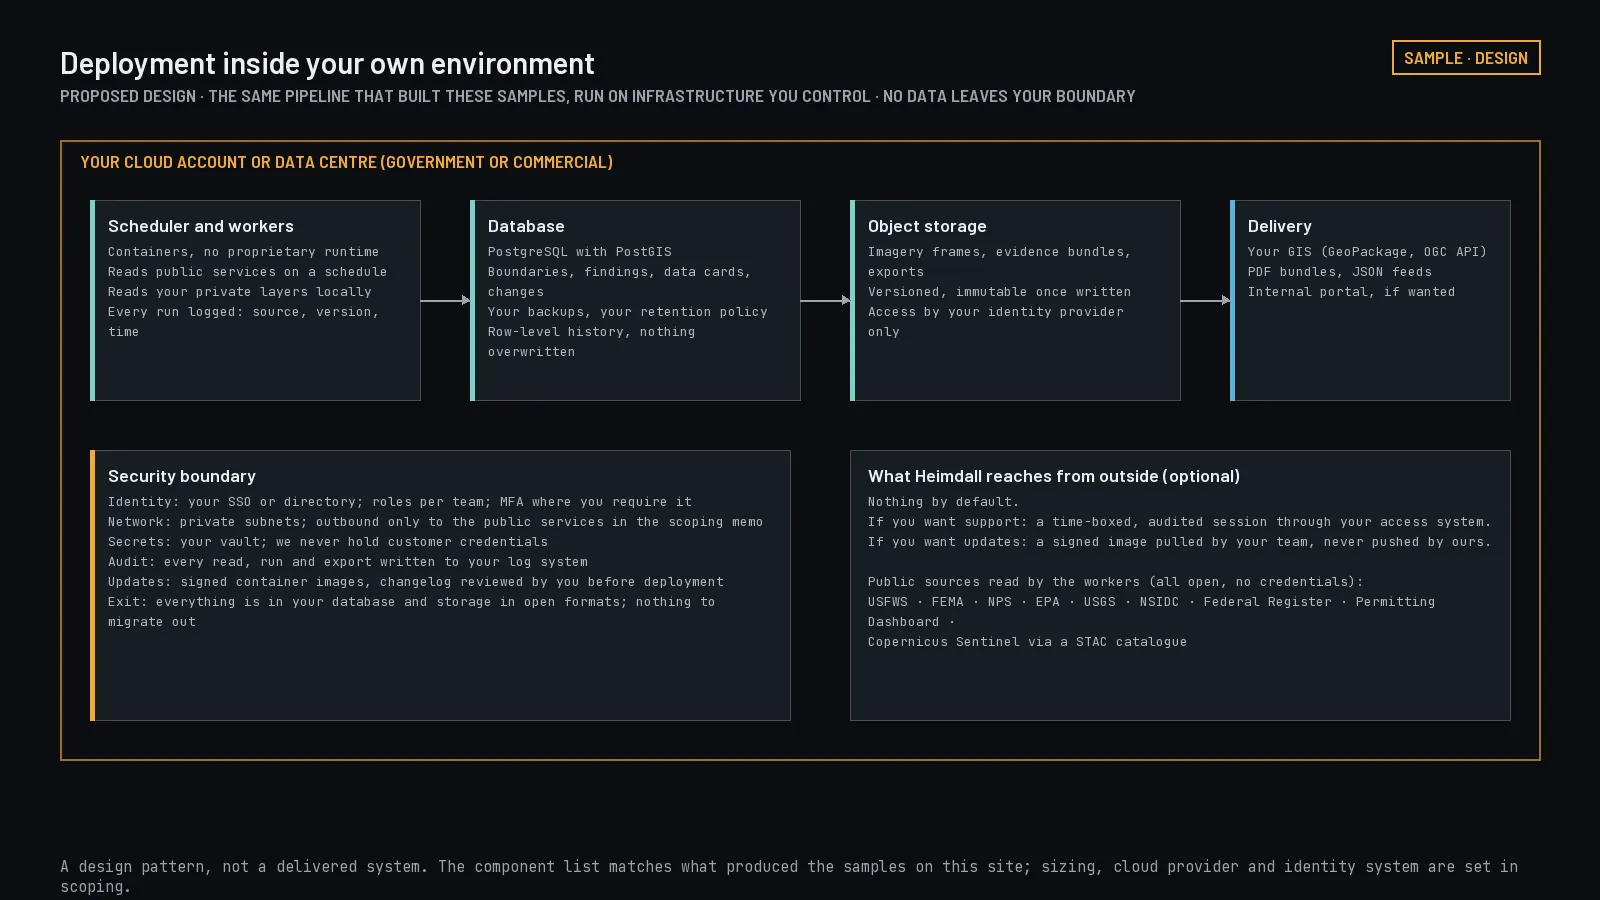
Deployment inside your own environment
Assess and implement an analytical system within an environment you control.
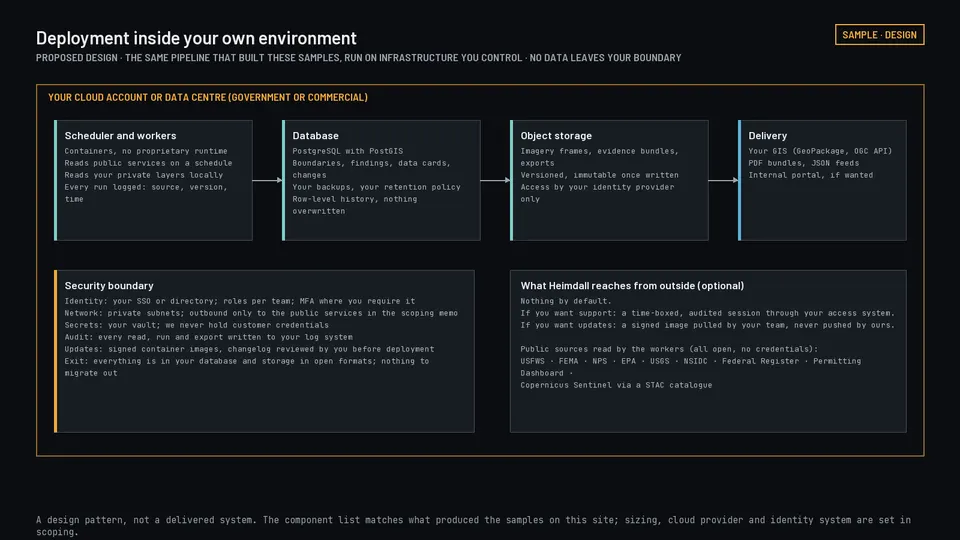
Proposed design: the same pipeline run inside your own boundary. Select to open.
Illustrative engagement
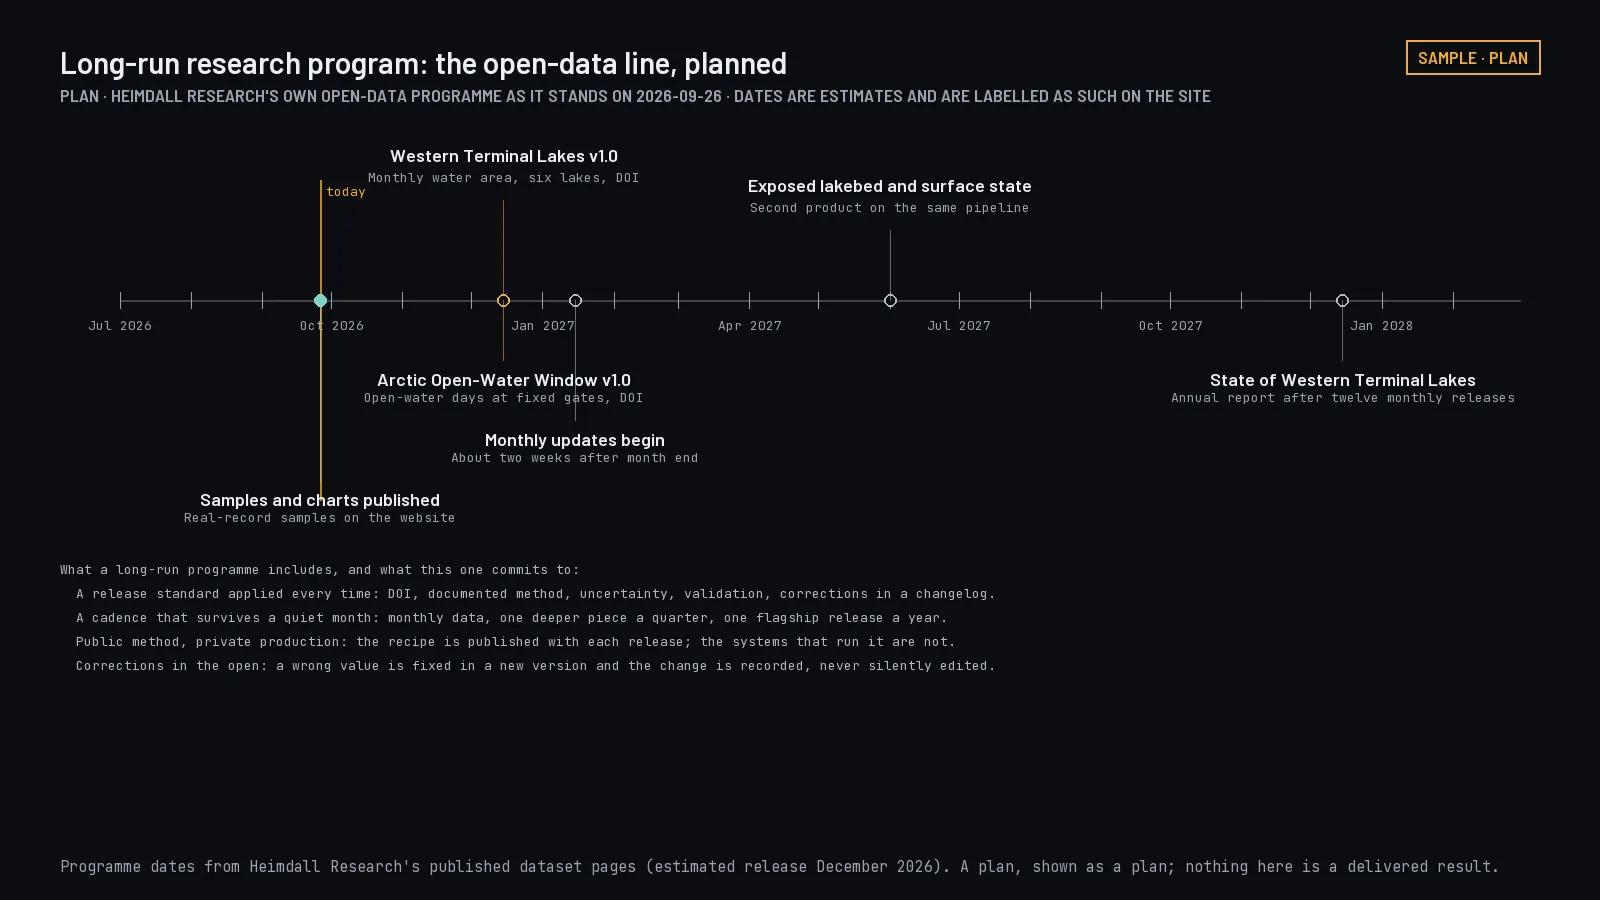
Long-run research program
Analyze a defined historical collection of spatial or scientific records and deliver the tables, maps, and written analysis that come out of it.
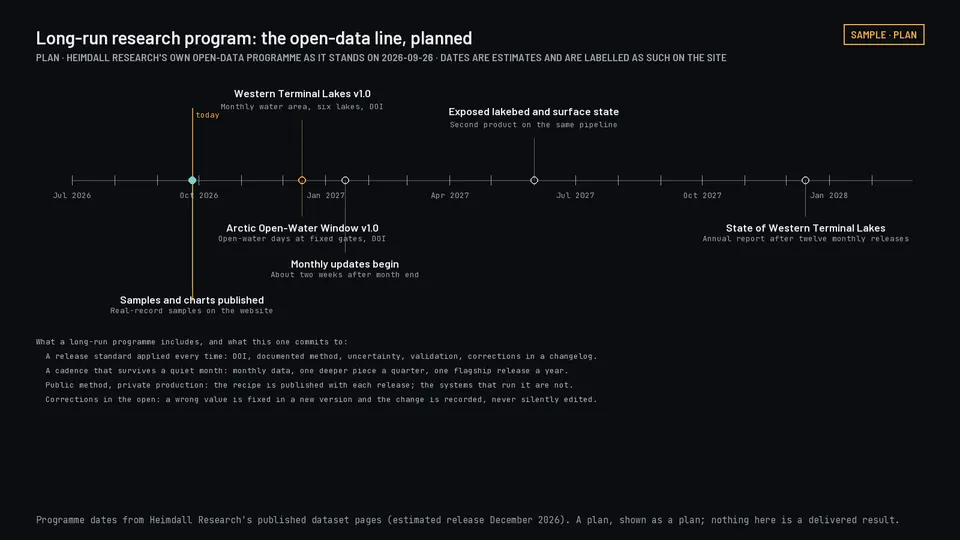
Our own open-data program, shown as a plan with estimated dates. Select to open.
Scoping studies and pilots are priced below the federal The dollar limit, currently $15,000, below which federal buyers may use simplified purchasing, often a government purchase card., so some may fit simplified purchasing routes; the buyer's contracting officer decides the requirements. Prices and timelines above are planning figures, not quotations, and not a ceiling. Commercial imagery, satellite tasking, third-party data, software licenses, and cloud usage are identified in the proposal, including whether they are included, passed through, or bought by you directly.
Data products
Open data
Free under the license stated on each release, including commercial use, with credit. See the catalog.
Licensed data
Priced by coverage, update frequency, permitted use, and how it is delivered. Tell us the area and the use case and we will send terms and a sample. See the products, plans and prices, or request a quote.
Custom datasets
Built around your question and the outputs you need, under a separate agreement. Tell us about it.
Get in touch
For projects, collaborations, or questions about our data.