Examples of what we make, each with its actual output. Open one to see what it does, who it is for, and how to get it.
Satellite radar, Ilulissat Icefjord, Greenland, every 12 days from Aug 2024 to Oct 2025
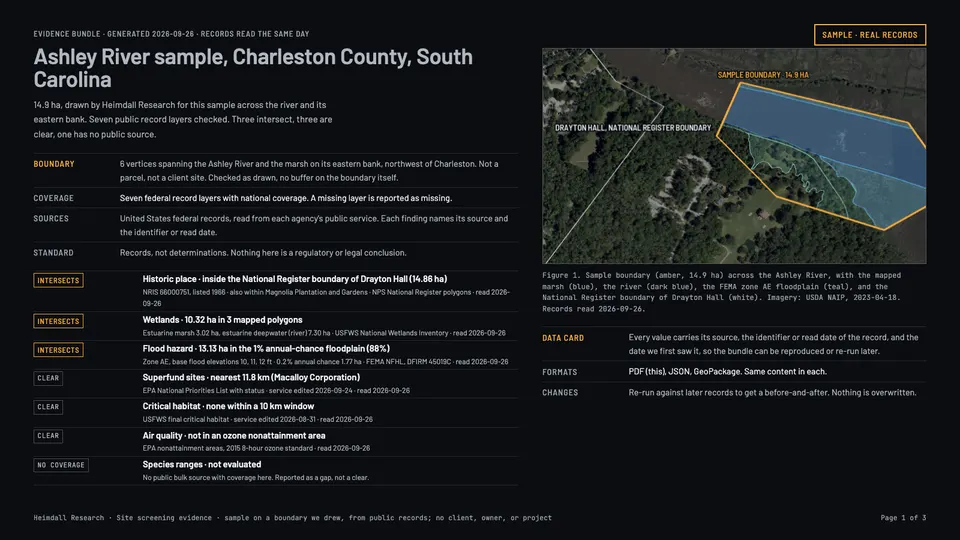
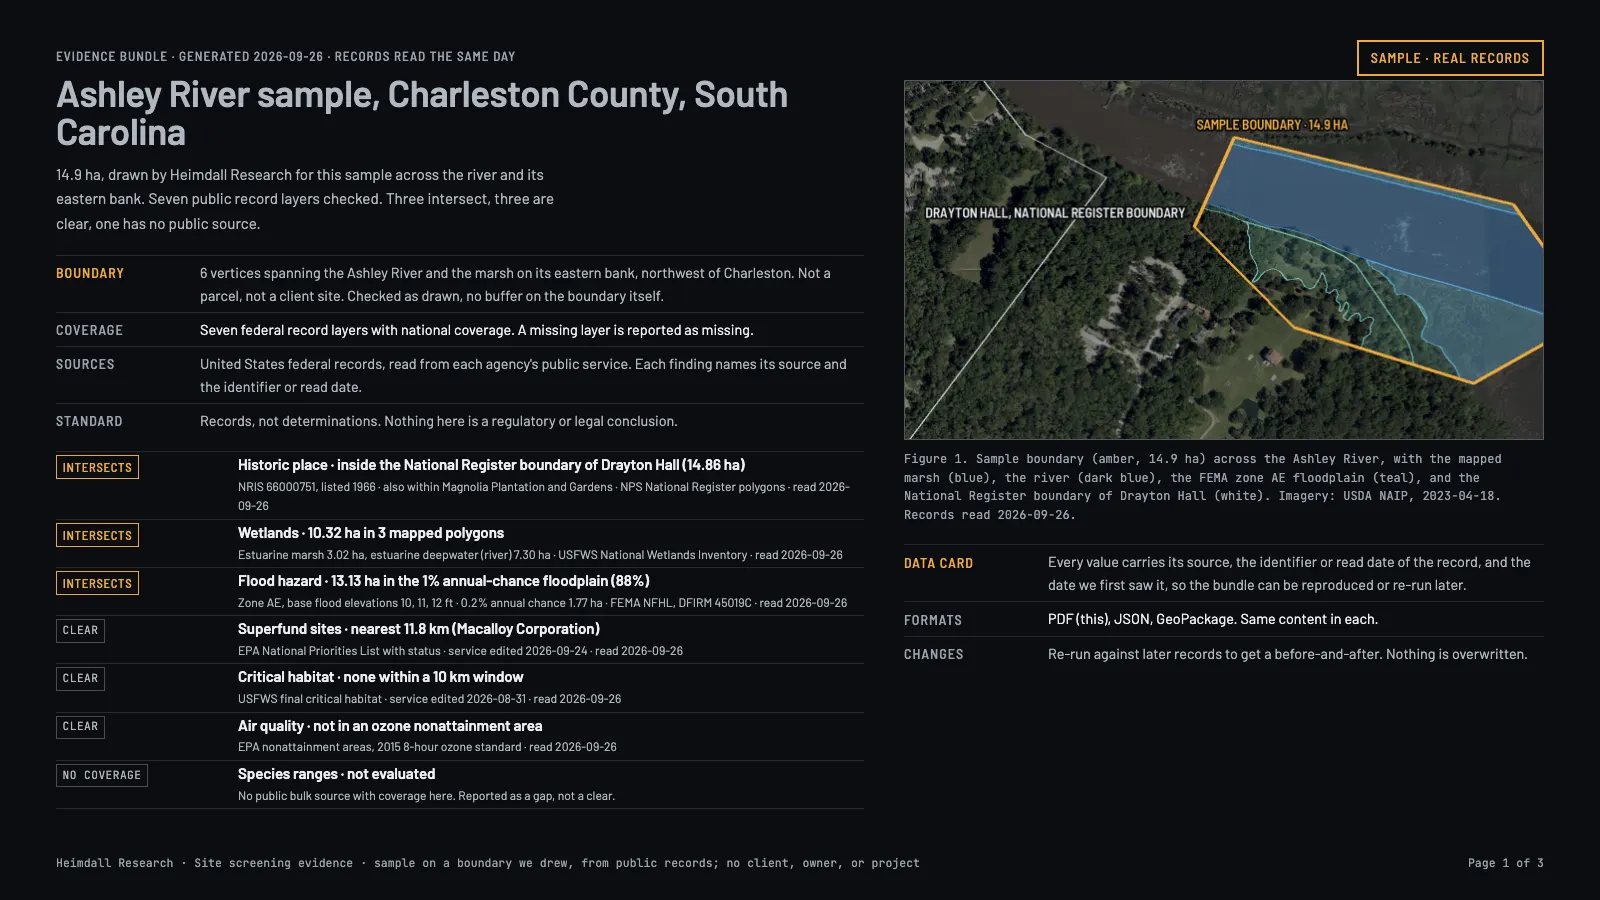
Screen a site against supported federal environmental datasetsGive us a boundary and see which wetlands, floodplains, streams, habitat, contaminated sites, and past federal reviews touch it, each with its source.Licensed data product · PlannedA boundary we drew across the Ashley River, South Carolina, checked against seven federal layers on 26 September 2026.
Reads the national federal layers for your boundary and lists the records from those layers that touch it, with the source, the version, and the date we read it. The result names each layer searched and where its coverage stops; a layer with no coverage is never reported as a clean result. Each finding points to the record behind it.
Who uses it
Developers, consultants, and agencies screening a site before they commit money to it.
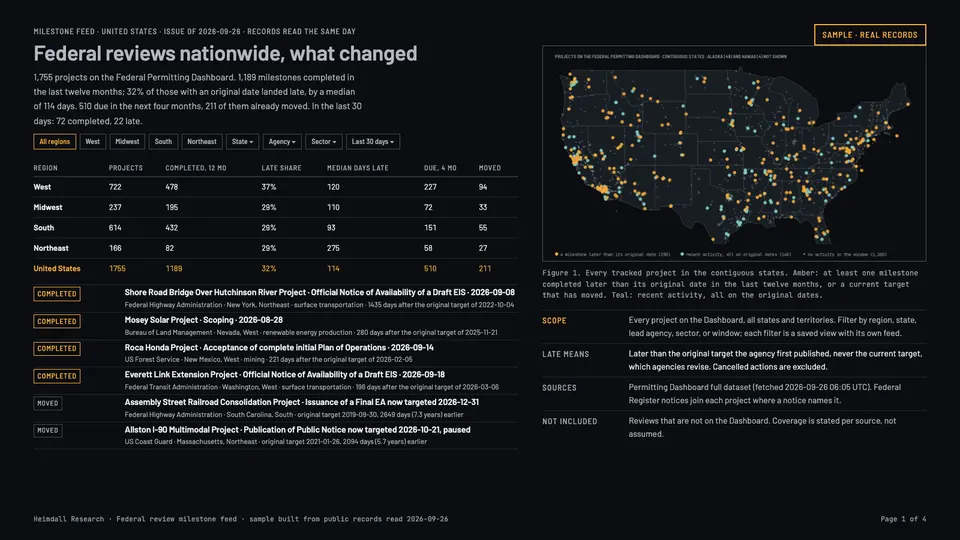
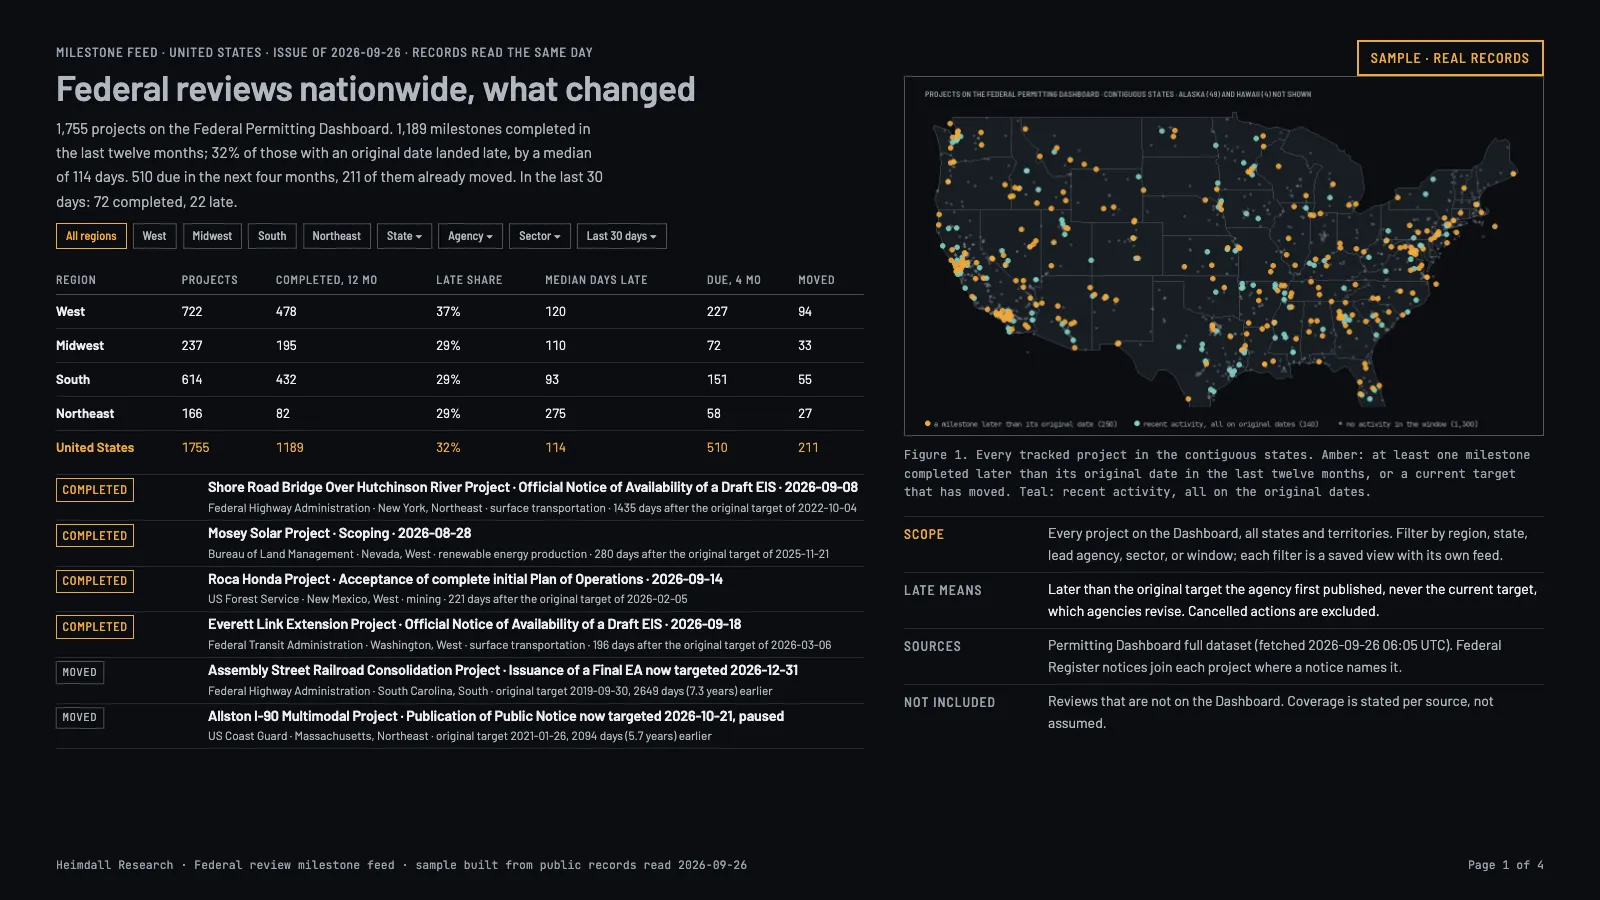
Track published federal environmental-review milestonesNotices and milestone dates from the federal systems that publish environmental reviews, and where schedules slip, with each field linked to its source.Licensed data product · PlannedThe national issue of 26 September 2026, every project on the Federal Permitting Dashboard.
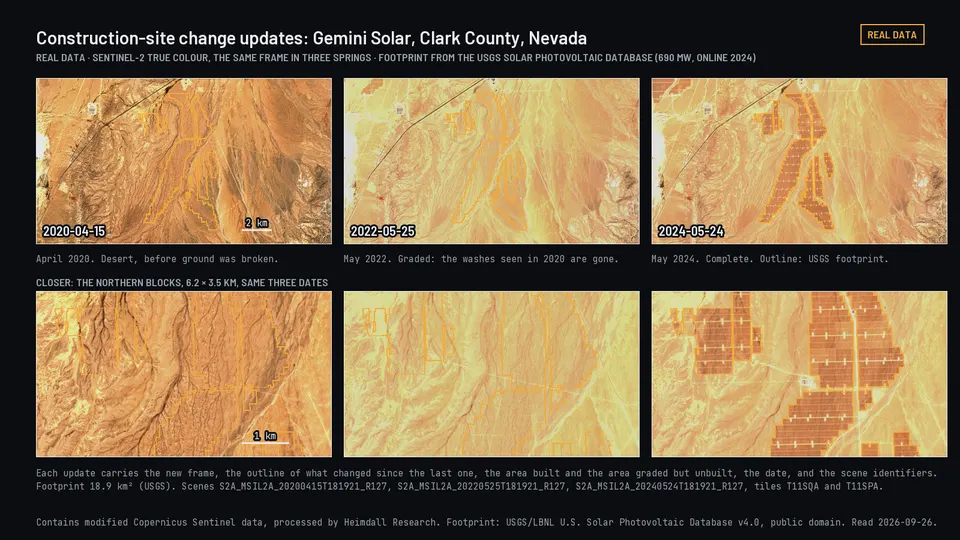
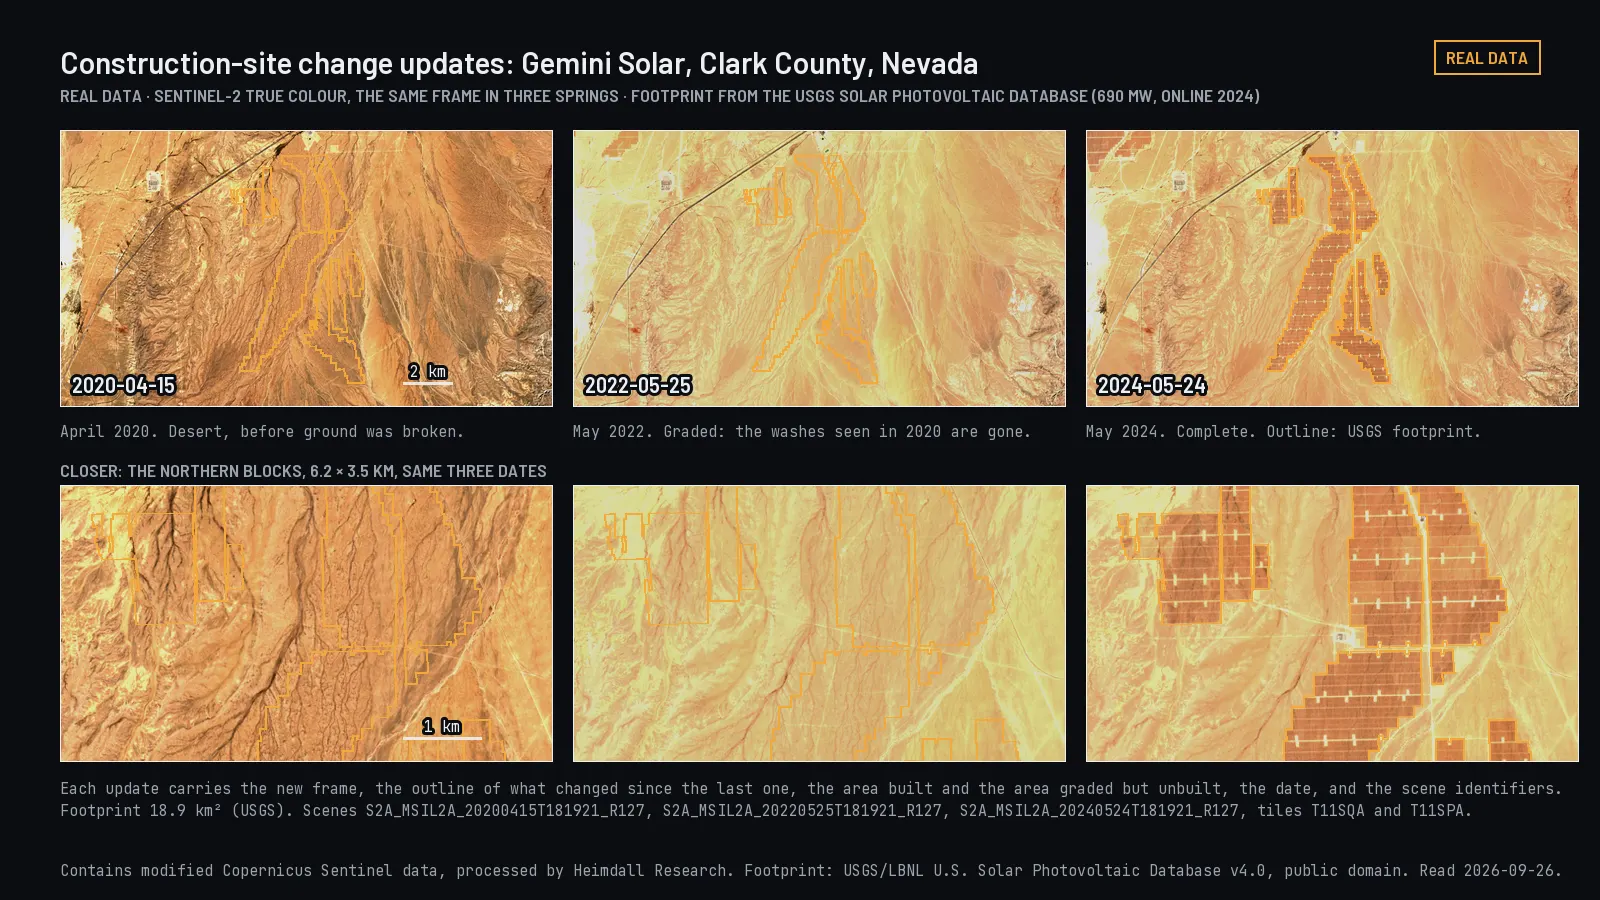
Watch places change over yearsSeveral years of satellite imagery over the sites you care about, compared with what the records say should be there.Reference implementation · Portfolio monitoring is plannedThe Gemini solar plant in Clark County, Nevada, in three springs as it was built.
Pulls optical and radar imagery for each location, compares it with the record, and flags the sites where something changed. A person reviews anything the automatic check cannot settle.
Who uses it
State and federal agencies, land and resource managers, infrastructure operators, and environmental researchers.
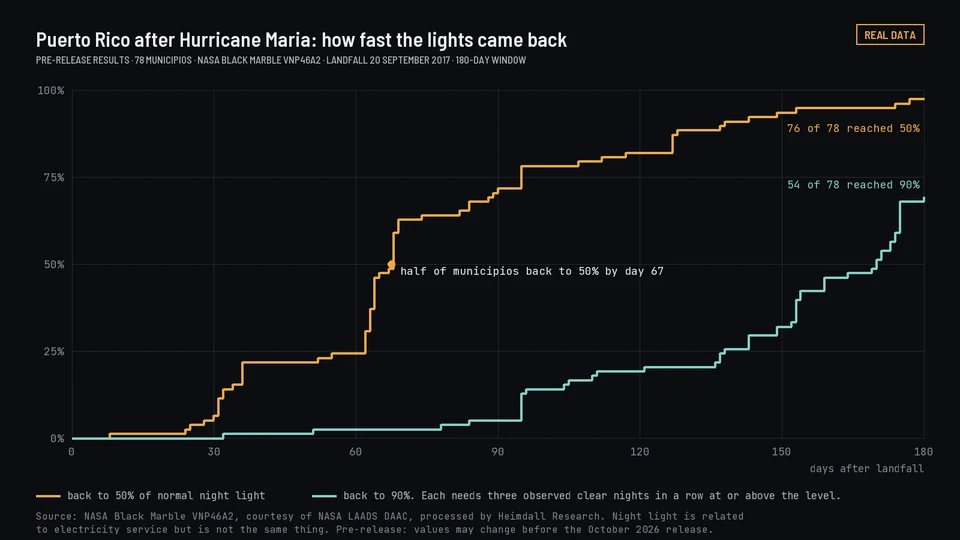
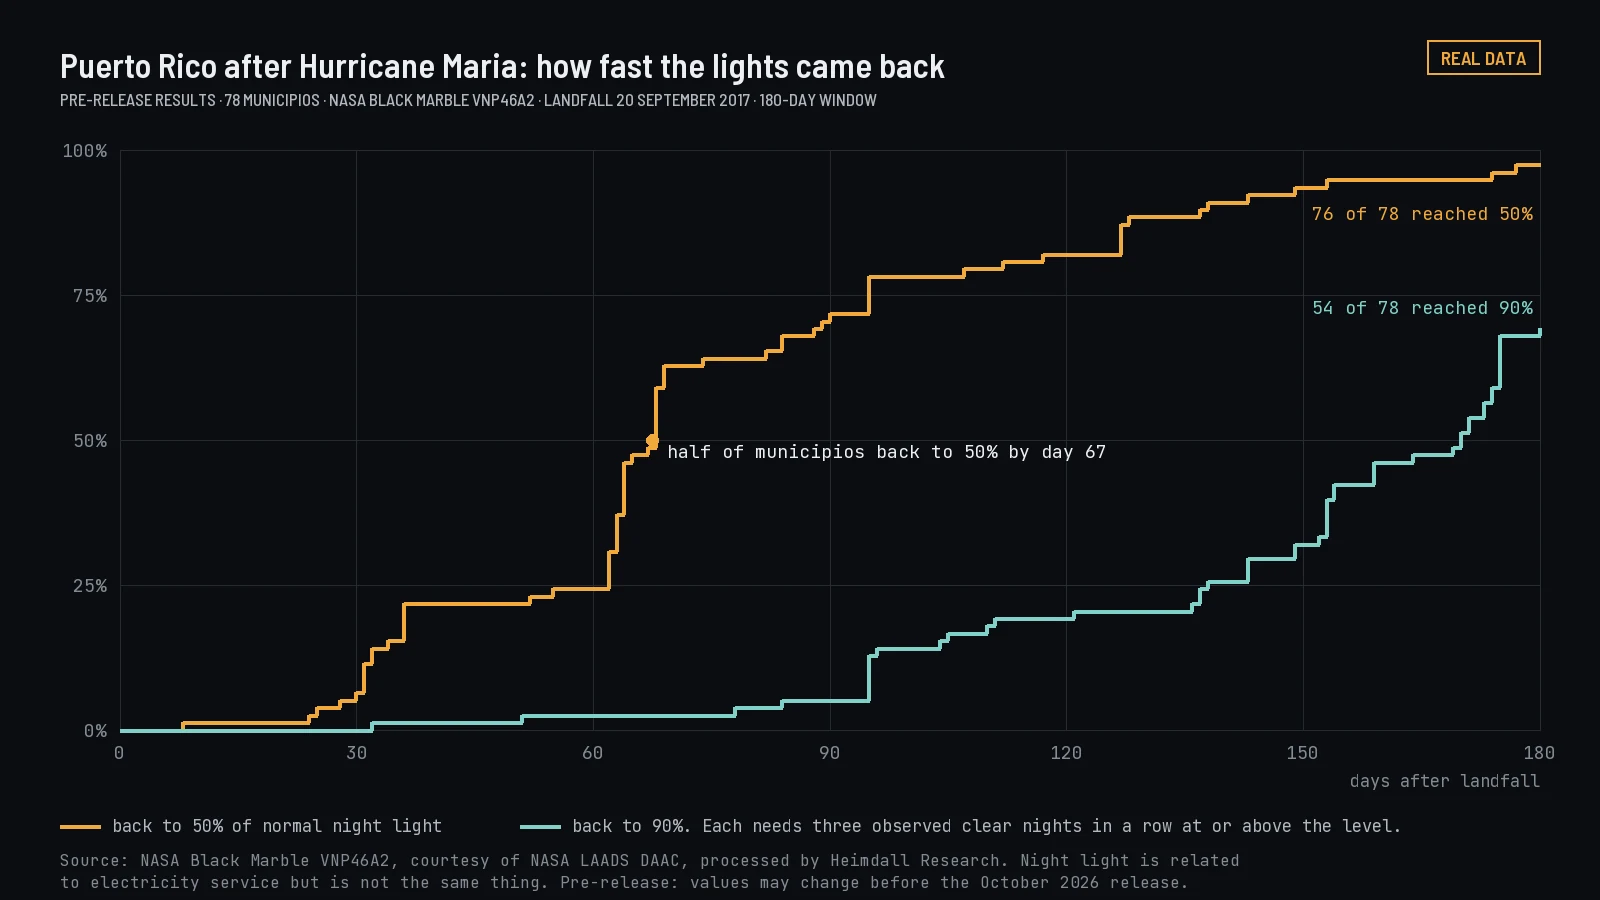
County night-light readings after U.S. stormsCounty night-light readings after 672 FEMA-declared U.S. storms, with reported utility outages from EAGLE-I where they exist.Puerto Rico night light after Hurricane Maria, from NASA Black Marble nightly readings.
Night light was compared with EAGLE-I outage records. Scored against reported outages, the result is weak.
Who uses it
Resilience and disaster researchers, insurers, emergency managers, and utilities.
Want this?
Free: the Storm Blackout and Restoration dataset, version 1.2. Paid: reports for one storm and one area. Paid plans start January 1, 2027, on plans and prices. Estimates from public records and satellite night light. Not for real-time emergency response or for any decision about one address or property.
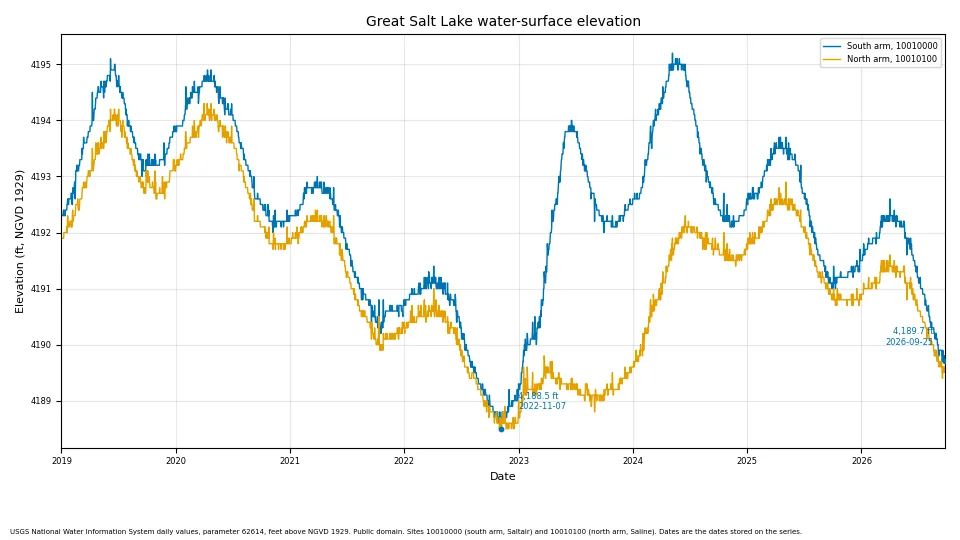
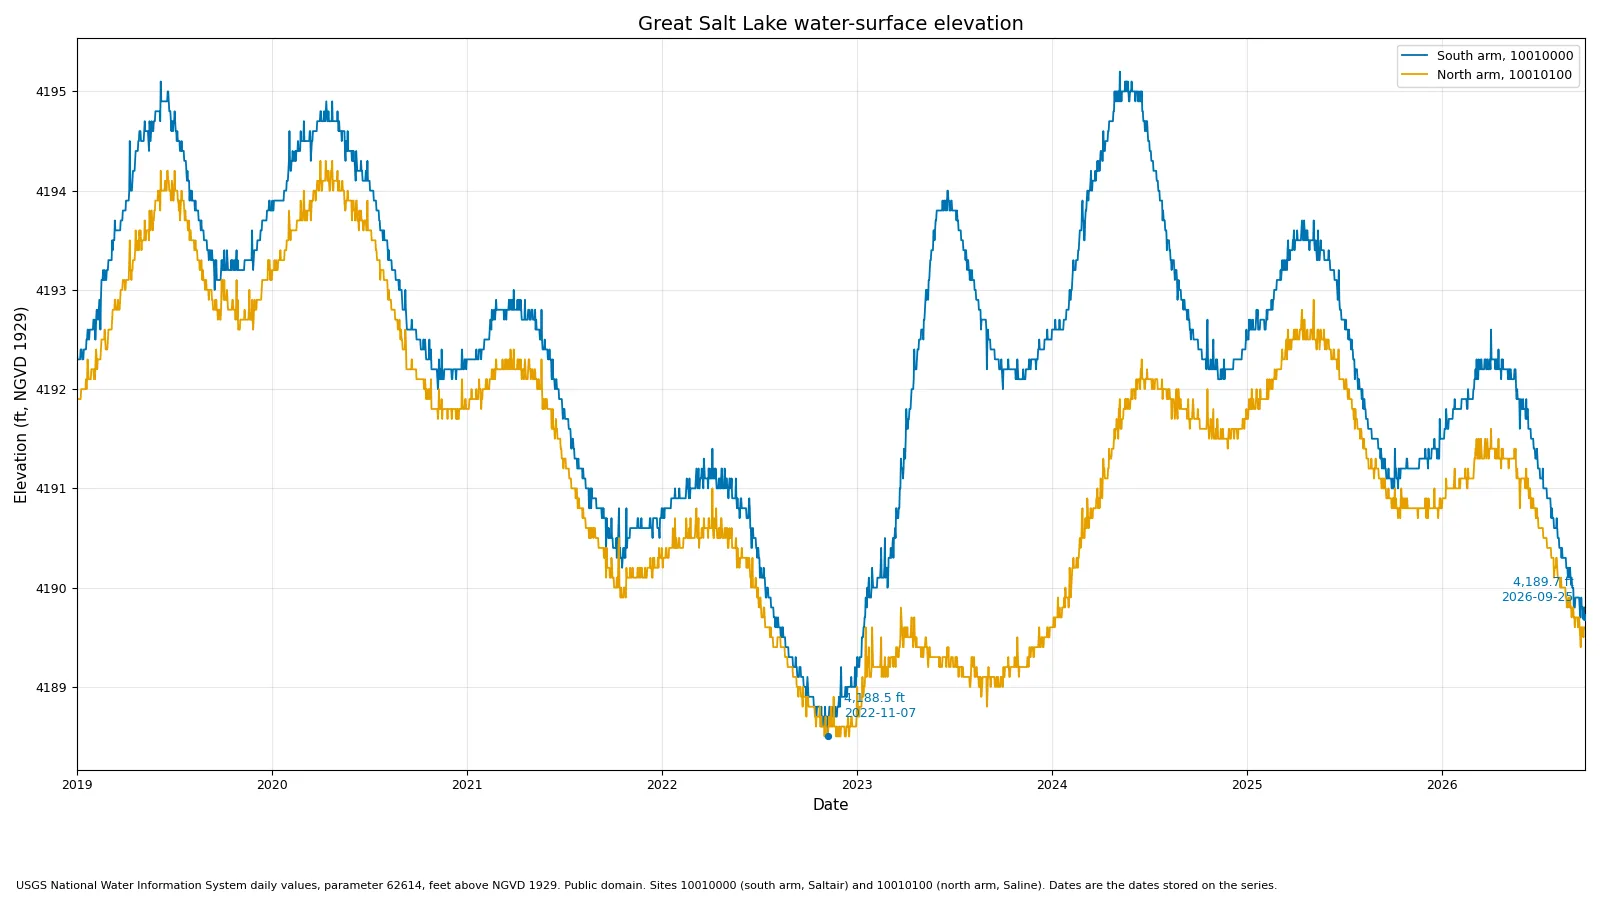
Keep one record for each lake or reservoirLevel, water area, and storage from gauges and satellites, reconciled into one history per lake.Real data: Great Salt Lake's two arms from USGS gauges, 2019 to 2026, the record our satellite measurements are checked against.
Measures water area from satellite imagery and joins it to the gauge and reservoir records for the same lake, with units reconciled and a quality flag on every value.
Who uses it
Water managers, irrigation districts, utilities, and researchers.
Want this?
Free: Western Terminal Lakes. The weekly lake watch is planned. Not for water-rights, legal or engineering decisions.
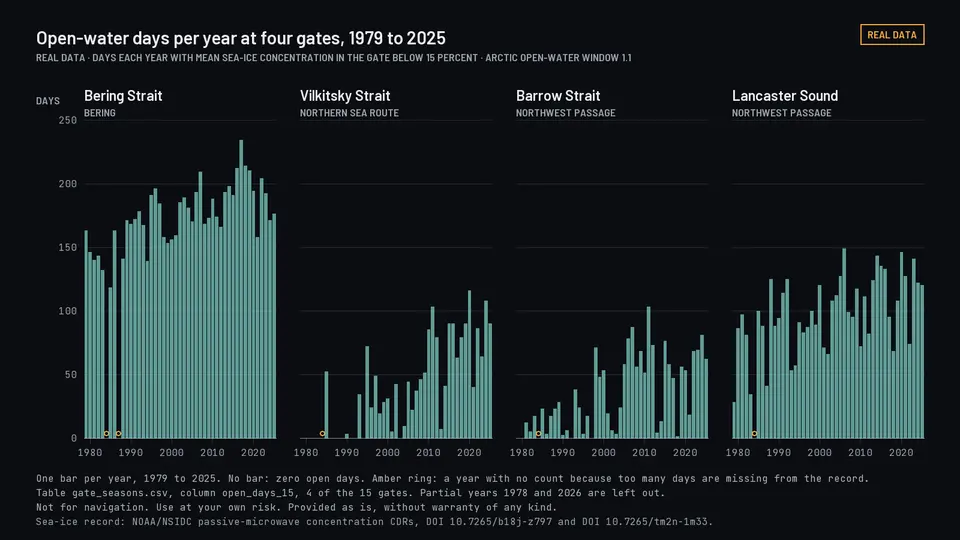
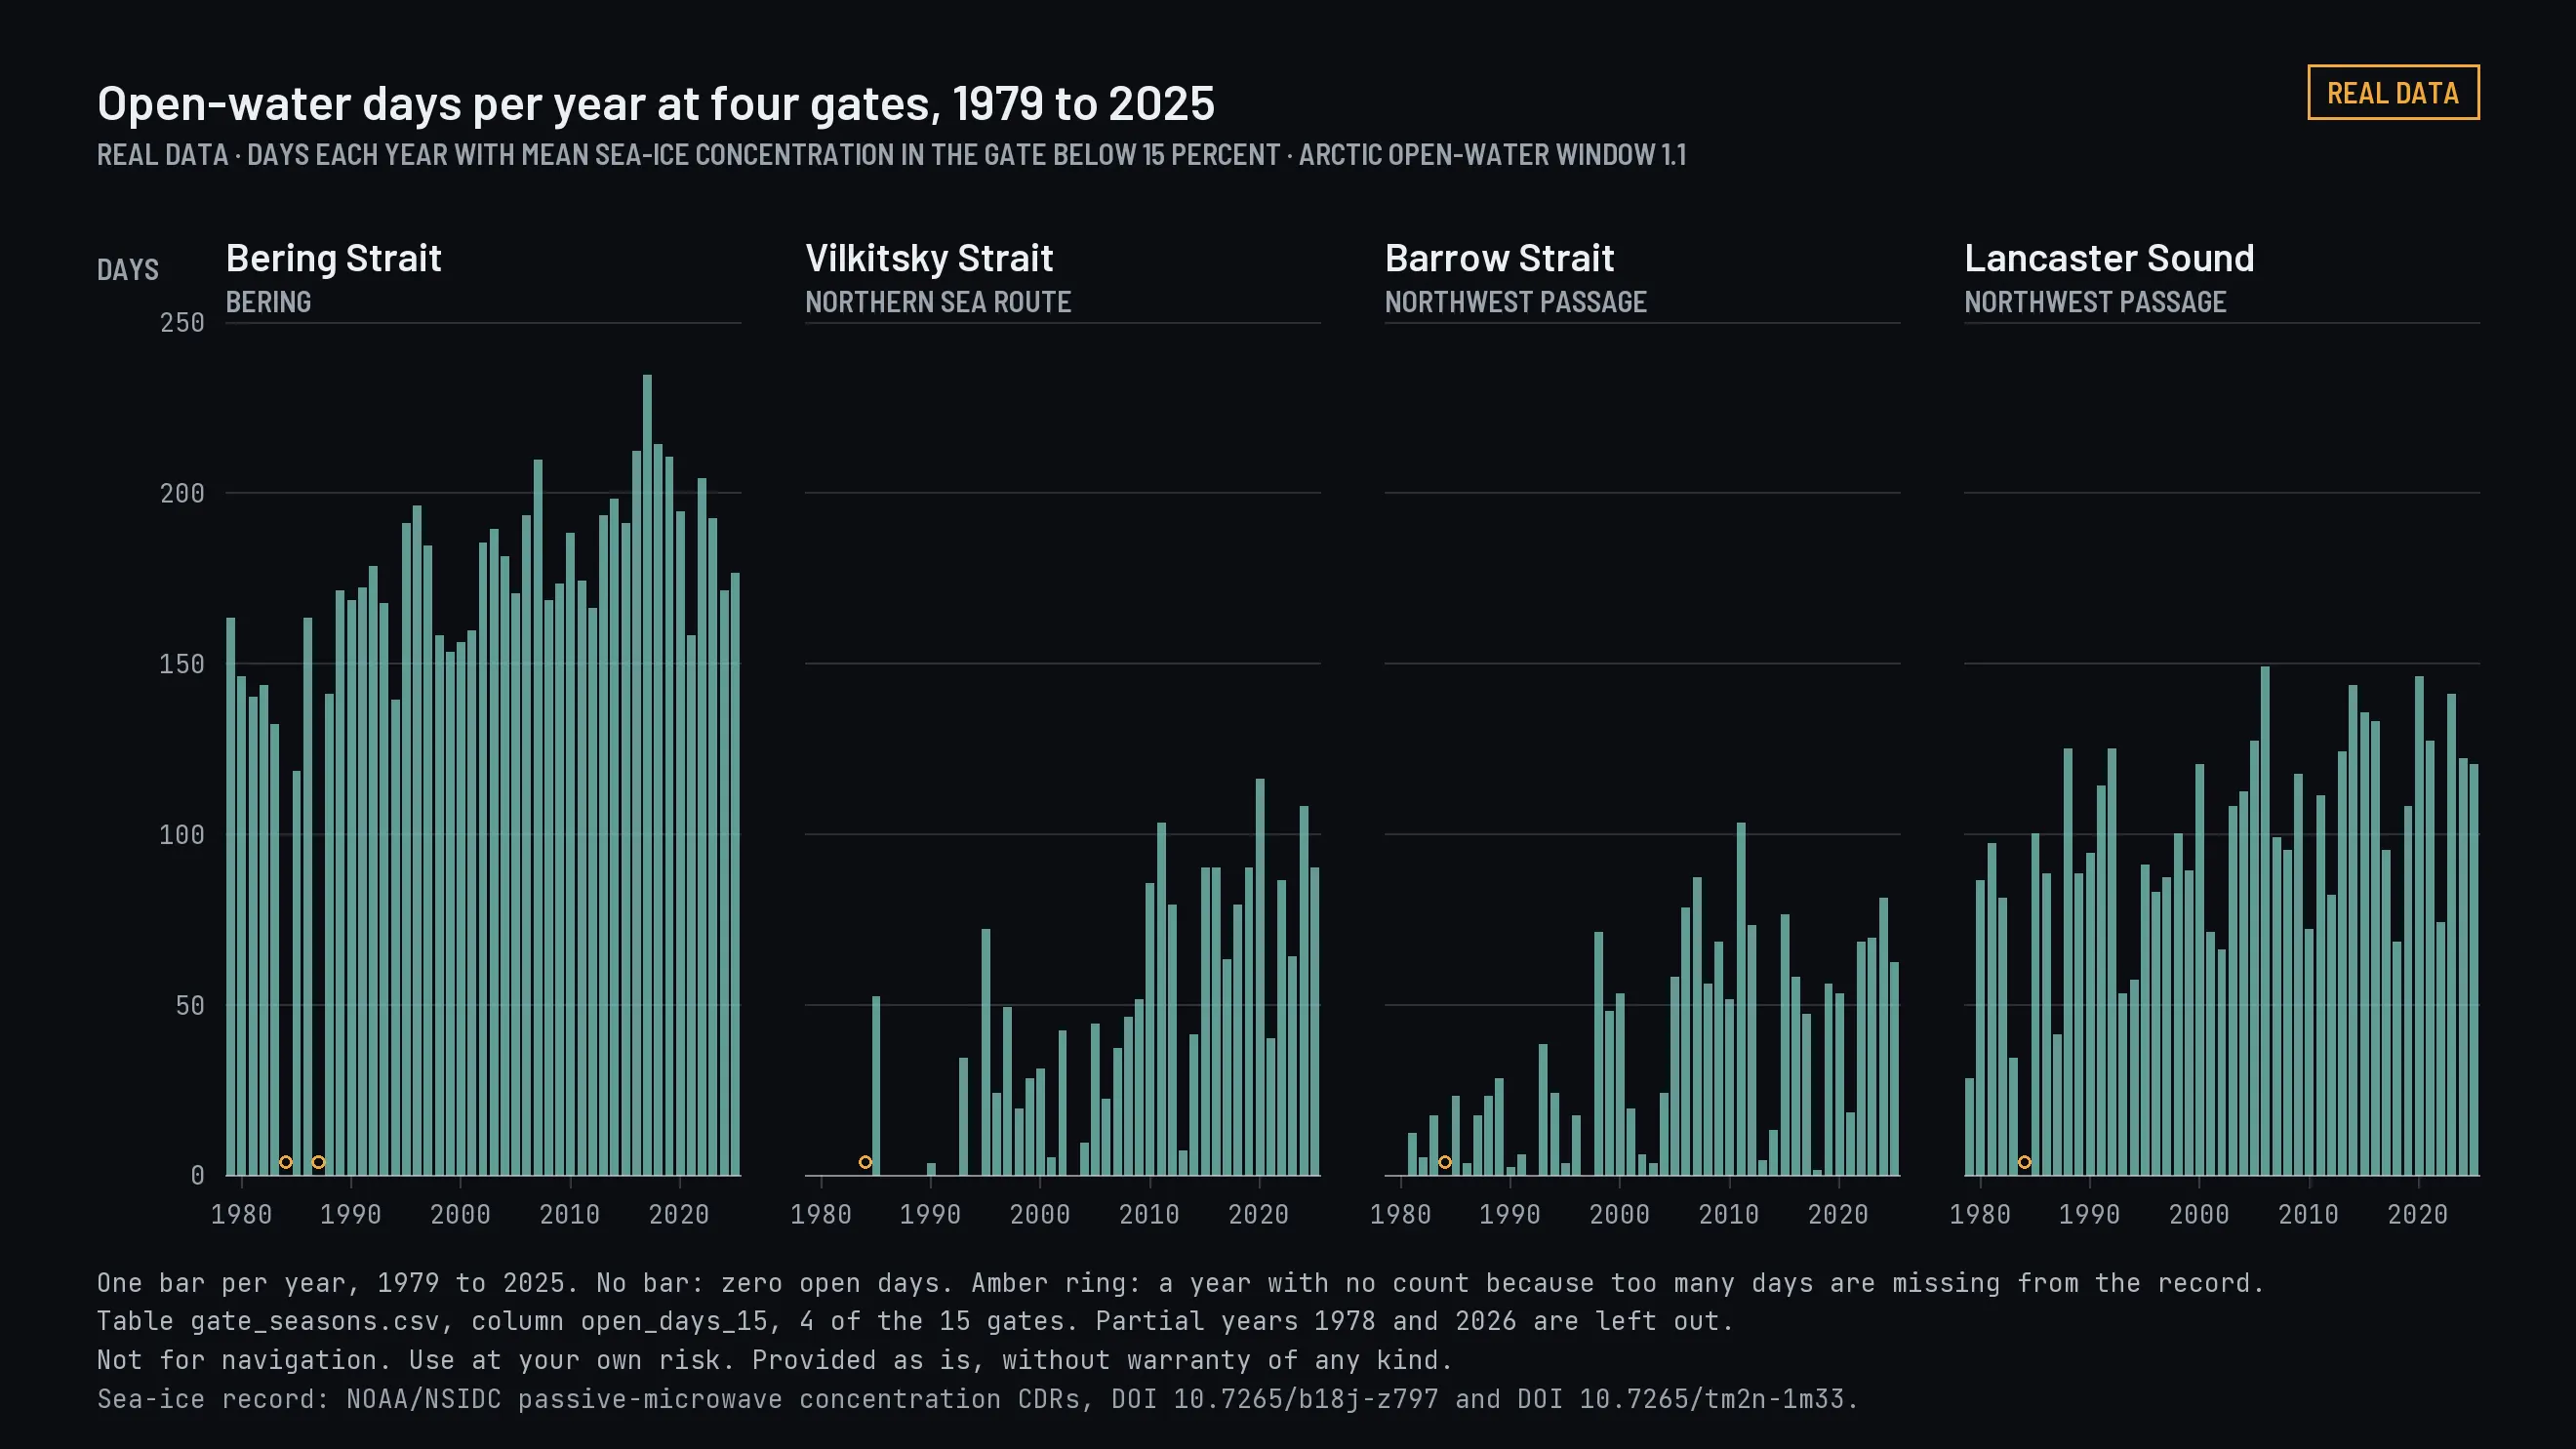
Count open-water days in the ArcticHow many days each season the Bering Strait and other Arctic passages are open water, 1978 to 2026 (1978 is a partial season).Open-water days per year at four of the 15 gates, 1979 to 2025, from Arctic Open-Water Window 1.1.
Reads the NOAA/NSIDC sea-ice record at fixed gates in each passage and counts the open days each season, with a newer radar measurement tested against it.
Who uses it
Researchers and planners studying how Arctic seasons are changing. Not for navigation. Use at your own risk. Provided as is, without warranty of any kind.
Want this?
Free: Arctic Open-Water Window. Version 1.1, published 2026-10-10. DOI 10.5281/zenodo.23147722. No paid version is offered.
Open datasets under CC BY 4.0. Arctic Open-Water Window 1.1, Western Terminal Lakes 1.1 and Storm Blackout and Restoration 1.2 were published on 2026-10-10.
Mitigation cost estimates and report-ready text for NEPA reviews, inside ArcGIS. Built by Heimdall Research in conjunction with Radial Spatial, 2025 to 2026. Colorado. Completed.
Get in touch
For projects, collaborations, or questions about our data.