
All findings · Western Terminal Lakes
How much open water did the south arm lose between July 2019 and July 2026?
Great Salt Lake's south arm: July open water was 12% lower in 2026 than in July 2019.
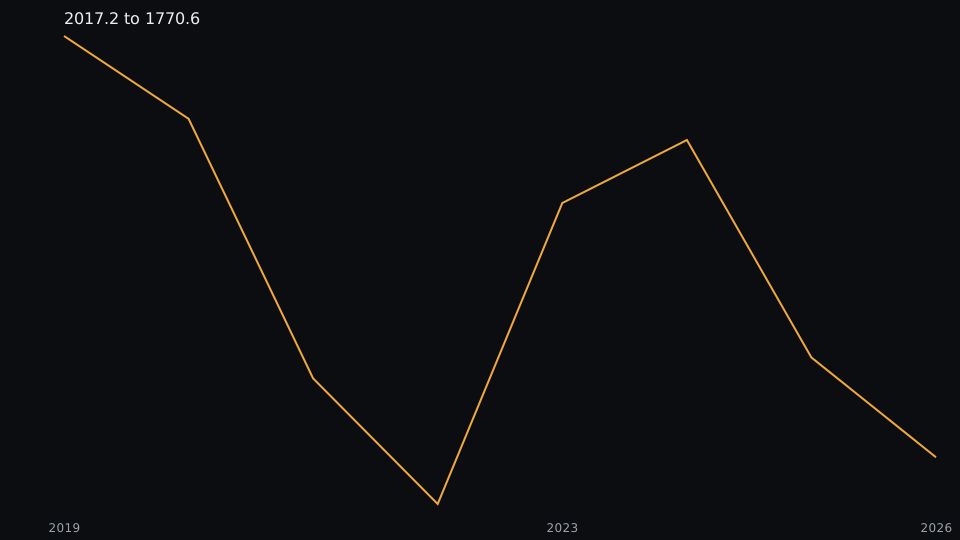
Great Salt Lake south arm open-water area fell from 2017.2 km2 in July 2019 to 1770.6 km2 in July 2026 (loss 246.5 km2, 12.2 percent).
These numbers are Western Terminal Lakes version 1.1, the published package (19 series on 18 lakes in version 1.1).
Chart
From the table
Reading
What the data shows
For great-salt-lake-south, water_area_km2 is 2017.2 in 2019-07 and 1770.6 in 2026-07. That is a loss of 246.5 km2, or 12.2 percent of the July 2019 area. This compares July 2019 with July 2026. July water_area_km2 values are 2019 2017.2; 2020 1968.7; 2021 1816.8; 2022 1743.3; 2023 1919.5; 2024 1956.3; 2025 1829.1; 2026 1770.6. Low-confidence Julys: none.
Context
Why it matters
South-arm open water bears on dust, habitat, and lake-level policy around the south arm. The USGS Utah Water Science Center notes dust from the dry lakebed as a possible health risk for northern Utah communities (USGS Great Salt Lake, page opened 2026-10-06). Satellite open-water area is not a water-rights number.
Method
How it was measured
The two months are 2019-07 and 2026-07. Each row has quality ok and is not marked low confidence. The change uses water_area_km2. The percent divides that change by the earlier area. This page is great-salt-lake-south. The loss is the absolute change. Method on the dataset page.
Limits
What this cannot tell you
Satellite open-water area is not a water-rights number. Lake volume and a legal level are outside this table. Ice months and low-confidence flags matter. This is the July 2019 month beside the July 2026 month. Disclaimer word for word: Not for water-rights, legal or engineering decisions.
Check
Check it yourself
- File
release/lake_monthly.csv- Column
water_area_km2- Row
lake_id great-salt-lake-south, months 2019-07 and 2026-07, quality_flag ok, low_confidence not true- API and assistant
- Same key, same data
This API call reads the same cells.
curl "https://api.heimdallresearch.com/v1/lakes/great-salt-lake-south" \
  -H "Authorization: Bearer $HEIMDALL_API_KEY"
This assistant prompt asks for the same cells.
MCP https://api.heimdallresearch.com/mcp question: What is water_area_km2 for great-salt-lake-south in 2019-07 and 2026-07 when quality is ok and low confidence is false?Citation
Dataset citation
Heimdall Research (2026). Western Terminal Lakes (Version 1.1) [Data set]. Zenodo. https://doi.org/10.5281/zenodo.23045007 Concept DOI https://doi.org/10.5281/zenodo.23045006.
- Version
- 1.1
- DOI
- 10.5281/zenodo.23045007
Notes on the wording and the comparison
The sentence on this page is the owner-picked wording. The marked numbers are filled from the check on this page. A later release stays in its own question file until that version is published. The published package is the version named in the citation on this page. Sorting the named file by the named column reaches the same cells. The comparison uses that published file and leaves later releases out. The data dictionary shipped with the package defines the column. A second person can repeat the aggregation from the file alone. Empty cells stay empty. The dataset page states the sensor and the public record behind the file. Rows left out of the aggregation are described in the method section. The download named in the citation is the file to open. The figure changes only when that published file changes. The same cutoff and the same columns are used for every row that enters the figure. A reader who wants the row list can filter the file with the check line on this page. The published package is the version named in the citation on this page. Sorting the named file by the named column reaches the same cells. The comparison uses that published file and leaves later releases out. The data dictionary shipped with the package defines the column. A second person can repeat the aggregation from the file alone. Empty cells stay empty. The dataset page states the sensor and the public record behind the file. Rows left out of the aggregation are described in the method section.
The sentence on this page is the owner-picked wording. The marked numbers are filled from the check on this page. A later release stays in its own question file until that version is published.
The figure is the aggregation named in the check. A different row filter would be a different figure.
A later published version can be set beside this one once that version is the cited release.
Related
Related findings
-
Great Salt Lake's north arm: July open water was 16% lower in 2026 than in July 2019.
Great Salt Lake north arm open-water area fell from 1369.9 km2 in July 2019 to 1149.3 km2 in July 2026 (loss 220.6 km2, 16.1 percent).
Breakdown
For great-salt-lake-north, water_area_km2 is 1369.9 in 2019-07 and 1149.3 in 2026-07. The loss is 220.6 km2, or 16.1 percent. This compares July 2019 with July 2026. July water_area_km2 values are 2019 1369.9; 2020 1350.3; 2021 1169.2; 2022 1181.5; 2023 1228.2; 2024 1203.7; 2025 1231.6; 2026 1149.3. Low-confidence Julys: none.
-
Salton Sea: July open water was 9% lower in 2026 than in July 2019.
Salton Sea open-water area fell from 850.4 km2 in July 2019 to 772.0 km2 in July 2026 (loss 78.3 km2, 9.2 percent).
Breakdown
For salton-sea, water_area_km2 is 850.4 in 2019-07 and 772.0 in 2026-07. The loss is 78.3 km2, or 9.2 percent of the July 2019 area. This compares July 2019 with July 2026. July water_area_km2 values are 2019 850.4; 2020 840.5; 2021 842.1; 2022 824.1; 2023 811.4; 2024 814.2; 2025 792.6; 2026 772.0. Low-confidence Julys: none.
-
Lake Abert: July open water was 7% lower in 2026 than in July 2019.
Lake Abert open-water area fell from 128.0 km2 in July 2019 to 119.5 km2 in July 2026 (loss 8.5 km2, 6.7 percent).
Breakdown
For lake-abert, water_area_km2 is 128.0 in 2019-07 and 119.5 in 2026-07. That is a loss of 8.5 km2, or 6.7 percent. This compares July 2019 with July 2026. July water_area_km2 values are 2019 128.0; 2020 110.0; 2021 81.7; 2022 136.4; 2023 110.1; 2024 129.6; 2025 131.8; 2026 119.5. Low-confidence Julys: 2022, 2023. An earlier published table for these two Julys showed a gain. This table shows a loss.
Not for water-rights, legal or engineering decisions.
Provided as is, without warranty of any kind.
        Source release/lake_monthly.csv y2020  1968.7.
        Source release/lake_monthly.csv y2021  1816.8.
        Source release/lake_monthly.csv y2022  1743.3.
        Source release/lake_monthly.csv y2023  1919.5.
        Source release/lake_monthly.csv y2024  1956.3.
        Source release/lake_monthly.csv y2025  1829.1.
        Source release/lake_monthly.csv m0 month 2019-07.
        Source release/lake_monthly.csv m1 month 2026-07.
        Source release/lake_monthly.csv a  2017.2.
        Source release/lake_monthly.csv b  1770.6.
        Source release/lake_monthly.csv delta  246.5.
        Source release/lake_monthly.csv pct  12.2.